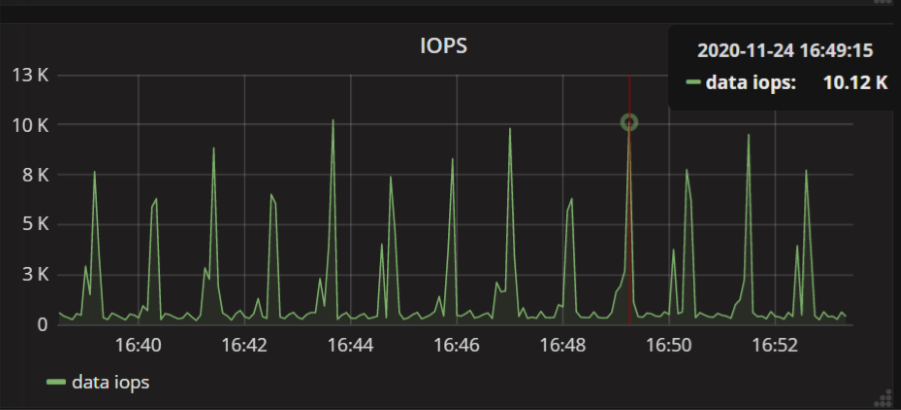
The input/output operations per second (IOPS) usage on an ApsaraDB for MongoDB instance is a key metric. If the IOPS utilization reaches or is close to 100% on an instance, the instance may respond slowly and even become unavailable. This topic describes how to view the IOPS utilization of an ApsaraDB for MongoDB instance and troubleshoot high IOPS utilization issues on the instance.
Background information
Typically, to prevent hosts from competing for I/O resources, most cloud database providers use techniques such as control groups (cgroups) to isolate I/O resources and limit IOPS. The upper limit of IOPS on instances varies based on instance specifications.
Usage notes
The IOPS Usage and IOPS Usage (%) metrics of the following instances cannot be displayed in the ApsaraDB for MongoDB console: standalone instances, replica set instances that run MongoDB 4.2 and use cloud disks, and sharded cluster instances that run MongoDB 4.2 and use cloud disks.
The IOPS Usage and IOPS Usage (%) metrics of the preceding instances are displayed as 0 on the Monitoring Data page in the console, which do not indicate the actual IOPS usage.
View IOPS utilization
View IOPS utilization in monitoring charts
Log on to the ApsaraDB for MongoDB console. In the Specification Information section on the Basic Information page of an instance, check the maximum IOPS of the instance. For more information about the upper limit of IOPS on instances of different instance specifications, see Instance types.
Log on to the ApsaraDB for MongoDB console. On the Monitoring Data page, determine the maximum IOPS based on the IOPS Usage and IOPS Usage (%) metrics. For more information about IOPS metrics, see Monitoring items and metrics.
Common causes of I/O issues
I/O issues may be caused by the following common reasons:
The memory is insufficient. I/O issues are closely related to the cache size in memory. Larger cache size allows larger volumes of hot cache data. The fewer disk I/O resources required by the system, the lower the probability of I/O bottlenecks. Smaller cache size allows less hot cache data. The system frequently flushes dirty pages to disks, which results in a higher probability of I/O bottlenecks.
Issues exist for parameters and configurations related to disk I/O. For example, journal logs and runtime logs frequently refresh, a write security mechanism (Write Concern) is improperly configured, or moveChunk operations are invalid for a sharded cluster instance.
Optimization strategies for I/O issues
We recommend that you select appropriate specifications for ApsaraDB for MongoDB instances and optimize indexing and writing policies of some application systems.
Configure appropriate specifications for ApsaraDB for MongoDB instances
The ratio of hot data size to cache size is difficult to predict. In most cases, the maximum CPU and IOPS utilization per day are both within 50%.
Optimize indexes
If queries cause full table scans or use improper indexes, high IOPS utilization occurs. For example, large numbers of I/O resources are consumed to export full table data. A large number of indexes generate large volumes of data, which results in the reduction of hot data in the WiredTiger cache. Business data writes require more than one I/O operation to update indexes, which affects I/O performance. In this case, we recommend that you create appropriate indexes.
Optimize business architecture and O&M
Take the following optimization measures to prevent disk I/O from becoming a bottleneck of the business architecture:
Control the number of concurrent write/read threads
MongoDB is a multi-threaded application. Fast concurrent writes and complex queries may cause IOPS bottlenecks and even lead to continuous latency on secondary nodes. If I/O bottlenecks are caused by the large volumes of written data, we recommend that you upgrade your instance to an ApsaraDB for MongoDB sharded cluster instance. This way, data is horizontally split by shards to linearly scale out the write performance of the instance.
Write data during off-peak hours
Regular writes or batch data persistence may cause maximum IOPS. In this case, if the current instance configurations do not meet the requirements of peak writes, we recommend that you upgrade the configurations to smoothly write business data. For example, add a random timestamp for each batch write operation.

Perform O&M operations during off-peak hours
O&M operations that heavily affect performance may cause peak IOPS. We recommend that you perform O&M operations during off-peak hours. Peak IOPS may be caused when you batch write, update, or delete data, add indexes, perform compact operations on collections, or batch export data.