Funnel analysis shows how an event changes in a defined process by using funnel chart. The funnel analysis is an effective way to calculate conversion rates on specific user behaviors. Data and business staff can utilize the analysis to improve enterprise operations and marketing strategy.
For example, when users shop in an App, they mainly go through the following steps: search goods, browse goods, add the goods to shopping cart, and make payment. To analyze their step-by-step conversion rate in a specific period from searching goods to making payment, you can create a funnel, add steps to conduct data analysis, and view the analysis result in the funnel chart and line chart.
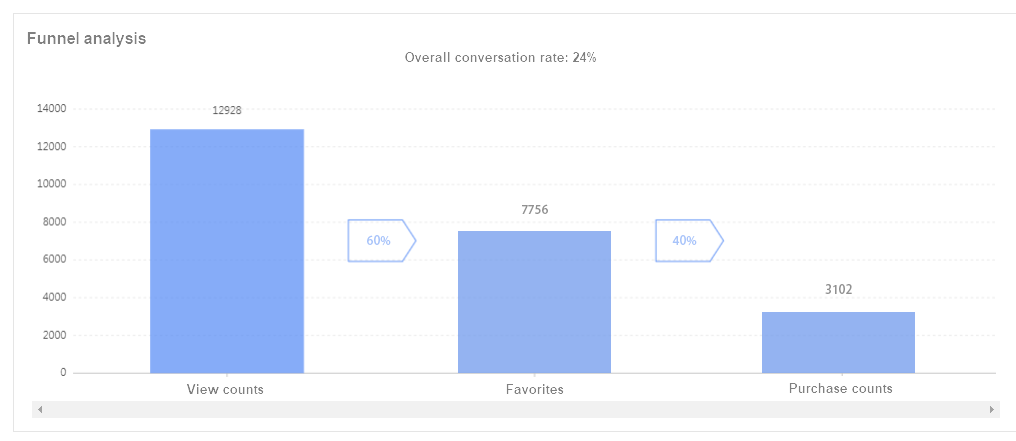
The funnel chart shows the data at each step and conversion rates among several steps.
Overall conversion rate = data in final step ÷ data in first step
For example, the following funnel chart shows the UVs (distinct count) in three steps and the conversion rates among the steps.

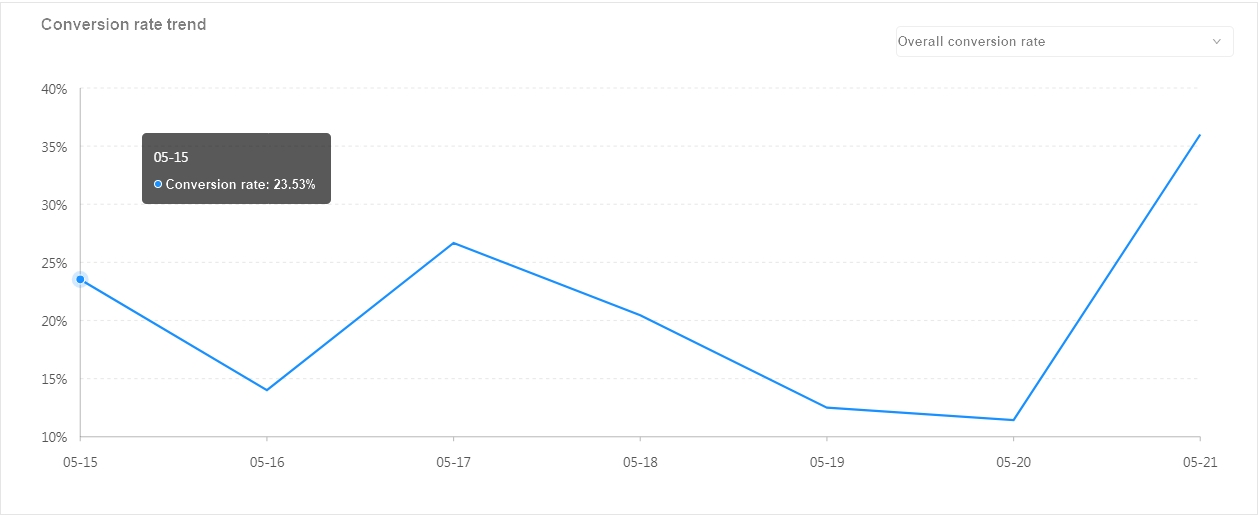
The line chart shows the event conversion rate in a specific time period.

The detailed data table shows the number of occurrences of the current funnel events on each device type and the specific conversion data of the funnel.