The MaxCompute Job O&M feature lets you view historical and running jobs. You can use this feature to understand job execution details, analyze resource loads during runtime, and perform job O&M.
Features
The MaxCompute Job O&M feature lets you view and manage historical and running jobs.
For data developers, the Job O&M feature helps you view job details, promptly detect and handle exceptions and issues, and terminate jobs.
For administrators, the Job O&M feature helps you view the resource load of a quota group at a specific time. This lets you efficiently allocate and manage system resources to improve job execution efficiency and performance.
On the Jobs page of the MaxCompute console, you can configure filter conditions to find specific jobs. This lets you view job details and perform analysis. The feature provides the following operations:
Operations
Filter jobs
You can filter jobs based on the parameters described in the following table. For more information, see Parameter description.
Sort jobs
By default, jobs are sorted by end time in descending order, with running jobs listed first. You can perform basic single-column sorting or advanced multi-column sorting.
Basic single-column sorting: Click the sort button in a column header to sort the data in ascending or descending order.
Advanced multi-column sorting: To perform a multi-column sort, click the Advanced Sorting button in the upper-right corner of the list. Then, click Add Sort to add multiple columns, specify the sort order for each column as Ascending or Descending, and click OK.
When advanced sorting is active, you cannot perform basic single-column sorting. To return to basic single-column sorting, click the Advanced Sorting button in the upper-right corner of the list, click Reset, and then click OK.
View job details
In the job list, click LogView in the Actions column of a job to open the LogView page. On this page, you can view the job's running status, execution details, and results.
Terminate jobs
You can perform the Terminate or Batch Terminate operation on jobs that have a Latest Status of
Running.Get job insights
In the job list, click Insights in the Actions column of a job. This lets you view the job overview, its resource consumption, and the resource allocation of the compute quota at a specific time. You can also trigger a job smart diagnosis.
Currently, smart diagnosis is supported only for SQL jobs.
For jobs that run for less than 2 minutes or are not SQL, MapReduce, Spark, or Mars jobs, job-level resource consumption data is not available.
Job statistics chart
A stacked column chart that shows job counts is generated based on the filter results and grouped by time and status. This chart helps you visualize the overall running status of jobs.
If you select a different Time Range, the duration represented by each column in the chart varies:
If the Time Range is within 24 hours: The minimum time interval for each column is 2 minutes. The number of columns is automatically adjusted, with a maximum of 24.
If the Time Range is more than 24 hours but no more than 48 hours: The time interval for each column is fixed at 2 hours. The number of columns is automatically adjusted, with a maximum of 24.
If the Time Range is more than 48 hours but no more than 7 days: The time interval for each column is 6 hours. The number of columns is automatically adjusted, with a maximum of 29.
The job statuses included in the statistics are:
Running: The snapshot status is Running.
Finished: The job has succeeded, failed, or been terminated.
Job snapshot data is collected every three minutes. Because of this, snapshot data may not be available for some jobs. The snapshot status for a running job might also be empty.
You can drag the mouse over the chart to select and shorten the time range.
Job list
The job list shows jobs that match your specified filter conditions and provides basic job information. MaxCompute provides a Regular Job List and a Snapshot List to suit different scenarios.
Regular Job List: View information about all jobs within a specific time range.
Snapshot List: View snapshot information for jobs that are running at a specific time. This includes the snapshot status, CPU and memory usage, request volume, and usage percentage at the snapshot time.
For a description of the parameters in the job list, see Parameter description.
Scope
The following job information cannot be collected currently:
Job snapshot data is collected every three minutes. Because of this, snapshot data cannot be collected for jobs that start within the three-minute interval before a collection.
Some MaxCompute jobs initiated through PAI, especially those initiated by RAM users, cannot be collected.
Jobs in Developer Edition projects (to be discontinued) cannot be collected.
Data is processed at a specific frequency. When you view the job list for the current time, some jobs with a Latest Status of Running may have already been completed in LogView. This discrepancy is more likely to occur for jobs with very short runtimes. The status in LogView is the most accurate.
Parameter description
Global job filter parameters
The following parameters affect the display of both the job statistics chart and the job list.
Parameter | Description |
Time Range |
|
Choose Project | Filters by MaxCompute project name. You can select multiple MaxCompute projects. By default, this is empty. |
Select Quota |
|
Job Type |
|
Job list search parameters
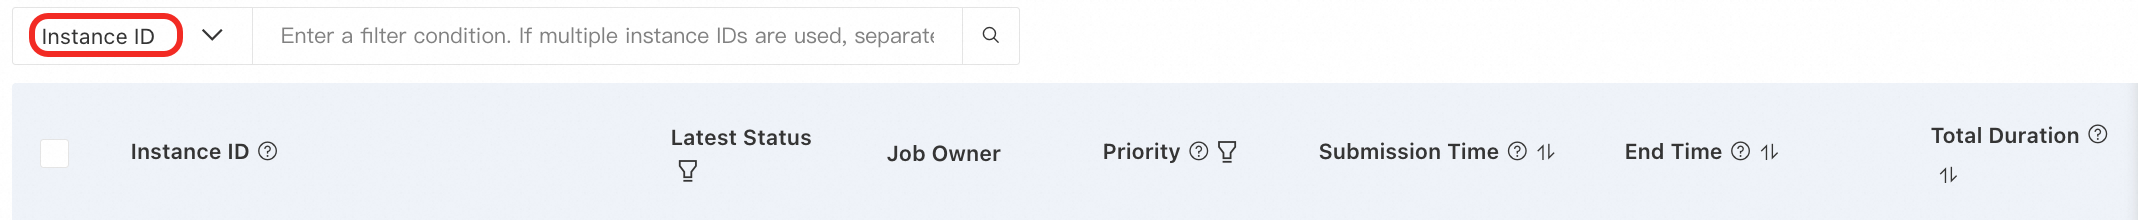
The following parameters are used to perform a secondary search on the results in the job list and affect only the job list. The following figure shows the location of the search controls:
Parameter | Description |
Instance ID |
|
Job Owner |
|
ExtNodeId |
|
ExtNodName | Searches by the source job name that ran the MaxCompute job. |
Signature | Searches by the signature of an SQL job. This is available only for SQL jobs. Use this signature to find all instances of the same SQL execution. By default, this is empty. |
Job list item filter parameters
The following parameters are used to perform a secondary filter on the results in the job list and affect only the job list. To filter, click the filter icon ![]() next to the column name.
next to the column name.
Parameter | Description |
Latest Status |
|
Priority |
|
Intelligent Diagnostics |
|
Normal list parameter description
Column Name | Description |
Instance ID | An instance is generated for each MaxCompute job, and each instance has a corresponding Instance ID. The project, computing quota, and type of the job are also displayed.
|
Latest Status | The latest status of the job. |
Job Owner | The Alibaba Cloud account that runs the MaxCompute job. You can find the job owner based on the account information. If a job consumes too many resources and affects other jobs, you can contact the owner to terminate the job. For information about how to terminate a job, see Instance operations. |
Priority | Each job has a priority from 0 to 9. A smaller value indicates a higher priority. High-priority jobs get compute resources before low-priority jobs. For more information, see Job priority. |
Submission Time | The time when the instance was submitted. |
Start Running Time | The time when the job received the first computing resource. If the running time of a job is too short or a job does not consume computing resources, such as DDL statements, use the submission time of the job instead.. By default, this is not displayed. You can customize the list options to display it. |
Waiting Duration | The duration from the time a job is submitted to the time it starts to run. If the job has no start time, the duration from the submission time to the snapshot time is displayed. By default, this is not displayed. You can customize the list options to display it. |
Execution Duration | The duration from the start time to the end time of a job.. By default, this is not displayed. You can customize the list options to display it. |
End Time | The end time of a job.. |
Total Duration | The total duration from the time a job is submitted to the time the job is terminated.. |
Total Used CPU Resources | The total CPU consumption throughout the job execution. The unit is |
Total Amount of Used Memory Resources | The total memory consumption throughout the job execution. The unit is |
CPU Utilization Percentage Snapshot | The latest CPU usage percentage collected for the job 1 minute before the deadline of the time range. It is calculated by using the formula: CPU Cores in Use/(CPU Lower Limit for Reserved CUs + Elastically Reserved Minimum CPU Utilization). This information is not available for pay-as-you-go jobs or jobs that cannot collect snapshot information. Sorting is not supported. If you need to sort data, go to the snapshot list. |
Memory Usage Percentage Snapshot | The latest memory usage percentage collected 1 minute before the job deadline of the time range. It is calculated by using the formula: Memory Size Occupied/(Minimum Reserved CU Memory + Minimum Elastically Reserved CU Memory). This information is not available for pay-as-you-go jobs or jobs that cannot collect snapshot information. Sorting is not supported. If you need to sort data, go to the snapshot list. |
Input Size | The amount of input data computed by the job. |
Intelligent Diagnostics | The tags generated from the job smart diagnosis results. |
ExtPlatformId | The client that initiated the job, such as DataWorks. The requester needs to pass this information when initiating the job. For more information about the conventions for passing information, see General job identification conventions. |
ExtNodeId | The task ID that corresponds to the job initiator, such as the ID of a DataWorks scheduling node. The requester needs to pass this information when initiating the job. For more information about the conventions for passing information, see General job identification conventions. |
ExtNodeName | The task Name that corresponds to the job initiator, such as the Name of a DataWorks scheduling node.. The requester needs to pass this information when initiating the job. For more information about the conventions for passing information, see General job identification conventions. |
ExtNodeOnDuty | The task owner that corresponds to the job initiator, such as the owner of a DataWorks scheduling node.. The requester needs to pass this information when initiating the job. For more information about the conventions for passing information, see General job identification conventions. |
Signature | The signature of an SQL job. You can use this signature to search for the instance on which the SQL job runs.. |
Snapshot list parameter description
Column Name | Parameter Description |
Instance ID | An instance is generated for each MaxCompute job, and each instance has a corresponding Instance ID. The project, computing quota, and type of the job are also displayed.
|
Snapshot Time | The time when snapshot information is collected for the job.. |
Snapshot Status | The status of a job at the snapshot time.. |
Job Owner | The Alibaba Cloud account that runs the MaxCompute job. You can find the job owner based on the account information. If a job consumes too many resources and affects other jobs, you can contact the owner to terminate the job. For information about how to terminate a job, see Instance operations. |
Priority | Each job has a priority from 0 to 9. A smaller value indicates a higher priority. High-priority jobs get compute resources before low-priority jobs. For more information, see Job priority. |
CPU Cores in Use | Number of CPU cores in use for a job at the snapshot time.. |
Requested CPU Cores | The number of requested CPU cores of a job at the snapshot time.. |
CPU Satisfaction Rate | Number of CPU cores in use/Number of requested CPU cores of a job at the snapshot time.. |
CPU Utilization Percentage Snapshot | The latest CPU usage percentage collected for the job 1 minute before the deadline of the time range. It is calculated by using the formula: CPU Cores in Use/(CPU Lower Limit for Reserved CUs + Elastically Reserved Minimum CPU Utilization). This information is not available for pay-as-you-go jobs or jobs that cannot collect snapshot information. Sorting is not supported. If you need to sort data, go to the snapshot list. |
Memory Size Occupied | The size of requested memory space of a job at the snapshot time.. The unit is automatically adjusted for display. |
Requested Memory Size | The size of requested memory space of a job at the snapshot time.. The unit is automatically adjusted for display. |
Memory Satisfaction Rate | Memory size occupied/Requested memory size of a job at the snapshot time.. |
Memory Usage Percentage Snapshot | The memory usage percentage of a job at the observation time, which is calculated by using the following formula: Amount of used memory resources/(Amount of reserved memory resources + Amount of elastically reserved memory resources).. This information is not available for pay-as-you-go jobs or jobs without snapshot data. |
Submission Time | The time when a job was submitted.. |
Total Duration | The total duration from the time a job is submitted to the time the job is terminated. |
ExtPlatformId | The client that initiated the job, such as DataWorks. The requester needs to pass this information when initiating the job. For more information about the conventions for passing information, see General job identification conventions. |
ExtNodeId | The task ID that corresponds to the job initiator, such as the ID of a DataWorks scheduling node. The requester needs to pass this information when initiating the job. For more information about the conventions for passing information, see General job identification conventions. |
ExtNodeOnDuty | The task owner that corresponds to the job initiator, such as the owner of a DataWorks scheduling node.. The requester needs to pass this information when initiating the job. For more information about the conventions for passing information, see General job identification conventions. |
Signature | The signature of an SQL job. You can use this signature to search for the instance on which the SQL job runs.. |
Common O&M scenarios
View the run details of a specific job
Scenario
You need to view the running status of a job initiated by a DataWorks hourly scheduling node or audit a specific MaxCompute job.
Procedure
Log on to the MaxCompute console and select a region in the top-left corner.
In the navigation pane on the left, choose .
On the Jobs page, select a Time Range as required and click Search.
Above the job list, select ExtNodeId or Instance ID and enter the corresponding value.
Click the
 icon to apply the filter.
In the results list, click LogView in the Actions column of the instance to open the LogView page and view detailed job execution information. For more information about LogView, see Use LogView 2.0 to view job run information.
View job run details for a specific period
O&M scenario
You need to view the jobs that ran in the last day for two projects that you are responsible for, Project_1 and Project_2, and analyze which jobs failed to resolve them.
Procedure
Log on to the MaxCompute console and select a region in the top-left corner.
In the navigation pane on the left, choose .
Set the Time Range to 1d or set the Time Range from
00:00:00on the current day to the current time.In the Choose Project drop-down list, select Project_1 and Project_2.
In the results list, click LogView in the Actions column of the target instance to go to the LogView page and view detailed job run information. For more information about LogView, see Use LogView 2.0 to view job run information.
View the resource usage of jobs for a subscription quota at a specific time
O&M scenarios
The resource usage of the Default Subscription Quota is high, and many jobs are waiting. You need to identify the specific jobs that are consuming the quota resources.
Procedure
Log on to the MaxCompute console and select a region in the top-left corner.
In the navigation pane on the left, choose .
Set the Time Range to 1h or customize the start and end times.
Set the Select Quota parameter to
Default Subscription Quotaand click Search.In the results list, check the CPU Utilization Percentage Snapshot and Memory Usage Percentage Snapshot for jobs whose Latest Status is
Running. You can check whether the job with the highest usage percentage is consistent with your business requirements and use other job information to determine whether the job is running as expected or needs to be terminated.In the results list, click LogView in the Actions column of the target instance to go to the LogView page and view detailed job run information. For more information about LogView, see Use LogView 2.0 to view job run information.
View the run details of an accelerated query job
O&M scenarios
You need to view the running status and details of accelerated query jobs from the last day.
Procedure
Log on to the MaxCompute console and select a region in the top-left corner.
In the navigation pane on the left, choose .
Set the Time Range to 1d and the Job Type to SQLRT (Query Acceleration), and then click Search.
In the results list, click LogView in the Actions column of the target instance to go to the LogView page and view detailed job run information. For more information about LogView, see Use LogView 2.0 to view job run information.
For jobs that use the accelerated query feature, multiple SQL commands may run in the same session. One session corresponds to one Instance ID. You can view the running status of all SQL commands in the session using the LogView for that Instance ID. Because of this, when you view accelerated query jobs on the Jobs page, note the following:
If the session has not exited (for example, if some SQL commands have finished but others are still running), the job's Latest Status is
Running.If the session expires or exits because the interface was closed, the job's Latest Status is
Cancelled.
View job resource consumption and the resource allocation of a computing quota at a specific time
O&M Scenarios
A job has been running for an extended period without completing, and the cause is difficult to identify in LogView. Alternatively, a completed job may have a longer-than-expected runtime. You need to analyze whether a resource supply issue is the cause.
Procedure
Log on to the MaxCompute console and select a region in the top-left corner.
In the navigation pane on the left, choose .
Select a Time Range and filter by the Select Quota parameter, then click Search.
Click Insights in the Actions column of the required Instance ID to open the Job Insights page.
On the Resource Consumption tab, view the resource consumption of the job throughout its lifecycle.
The resource consumption chart shows the change trends of used CUs and waiting CUs at the job level over time, along with the change trends of used CUs and waiting CUs at the quota level. If you find that the job's CU usage is low while the quota-level CU usage is high or continuously at its limit, this indicates that the quota resources are insufficient and other jobs are competing for compute resources with the current job.
Click a time point on the horizontal axis of the resource consumption chart to view the resource allocation of the compute quota at that time. This includes the number of jobs and their priority distribution. Click the color block for a target priority to open the job list and view the details of the corresponding jobs. This helps you identify which specific jobs are competing for compute resources with the current job. Based on your business needs, you can then optimize task execution, adjust job priorities, or manage compute resources. For more information, see Job priority or Compute resources - Quota management.
Next steps
If a job's resource usage percentage is consistently high and many other jobs are waiting, take the following actions:
If the job does not meet business requirements, stop the job.
If the job meets business requirements, the quota resource configuration is not suitable. In this case, you need to optimize the resource configuration. For more information, see Compute resource configuration optimization.
References
To view job information, check job status, and stop jobs using commands, see Instance operations.