To understand and analyze the expenses, computing resource usage, and storage resource usage incurred when you use MaxCompute, you can use the cost analysis feature provided by MaxCompute. This feature allows you to view resource usage details. It helps cost-sensitive administrators analyze expenses in a convenient manner and facilitates subsequent cost optimization. This topic describes how to use the MaxCompute cost analysis feature to analyze the details, percentages, or trends of expenses and resource usage.
Background information
The following figure shows how to use the cost analysis feature.
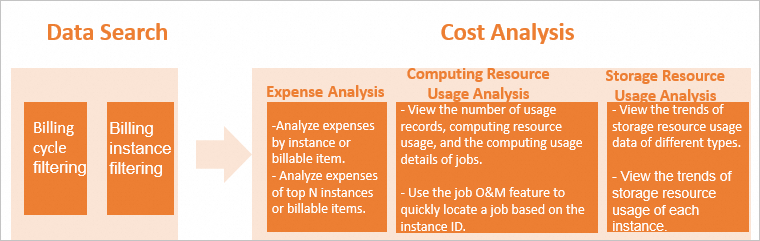
Data search: Select a billing cycle and a billing instance (optional) to search for data.
Perform cost analysis in the following dimensions:
Expense analysis: You can view the total expenses by instance or billable item and the percentages of expenses of each instance or billable item in a specified billing cycle, view the daily expense trend of each instance or billable item, and view the billing details of each instance or billable item in each billing cycle. The expense analysis helps you locate billing cycles, instances, and billable items when you encounter a sudden surge in expenses. It also helps you quickly check related expenses during expense auditing.
Computing resource usage analysis: You can view the number of usage records, usage, and detailed computing job statistics of one or more instances in a specified billing cycle. For example, if you need to check the cause of a sudden surge in the expenses of an instance (project), you can check the trend of the number of usage records and determine whether the surge is caused by a sudden increase in jobs. If the surge is not caused by a sudden increase in jobs, you can compare the trends of the computing resource usage of jobs and determine whether the surge is caused by an increase in computing resource usage. Then, you can check the usage data of jobs in the job details (instance details) to identify the job whose computing resource usage increase results in a sudden surge in the expenses.
Storage resource usage analysis: You can view the trends of daily storage resource usage of one or more instances in a billing cycle based on storage types and the trend of daily storage resource usage of each instance. This feature allows you to view the usage trends of different storage types and the average daily storage resource usage in a billing cycle. The daily storage resource usage is calculated by dividing the daily total storage resource usage of each instance by 24. Therefore, the daily storage resource usage is not the current storage resource usage.
Precautions
MaxCompute allows you to analyze the expenses of pay-as-you-go computing and storage resources. The expenses are directly calculated based on usage records by using billing formulas. In this case, the calculated expenses may be different from the expenses in the bills due to low precision and the use of approximate values. You can obtain the usage records from the Usage Records tab. A small amount of usage data may be available on the current day due to metering latency or a low data generation speed.
For more information about the billing rules of pay-as-you-go computing resources, see Computing pricing (pay-as-you-go). For more information about the billing rules of pay-as-you-go storage resources, see Storage pricing (pay-as-you-go).
The names of the billable items on the Expense Analysis tab are obtained from the metering types and are different from those in bills. For more information about mappings, see Expense analysis.
To use the cost analysis feature, you must be granted the required permissions in the Resource Access Management (RAM) console. By default, RAM users or RAM roles do not have the permissions. For more information, see RAM permissions.
Data search
You can view the data of the previous 12 months. The system started to record the data from May 7, 2023.
Log on to the MaxCompute console. In the top navigation bar, select a region.
In the left-side navigation pane, choose Cost Management > Cost Analysis.
On the Cost Analysis page, select a Billing Cycle.
By default, the data of the previous 7 days, including the current day, is displayed on the Cost Analysis page. You can also select another billing cycle. The longest duration of a billing cycle is 31 days.
Optional. Select one or more billing instances from the Billing Instance drop-down list.
A billing instance refers to a billing unit and indicates an instance displayed on the Usage Records tab in User Center. In most cases, the instance name is the project name. You can specify one or more billing instances. If you do not specify instances, the system considers that all instances are selected.
NoteIf the total expense of an instance is 0 in a specified billing cycle, the instance is not displayed in the drop-down list.
Expense analysis
On the Cost Analysis page, click the Expense Analysis tab.
On the Expense Analysis tab, analyze the expenses by instance or billable item.
Analyze expenses by instance:
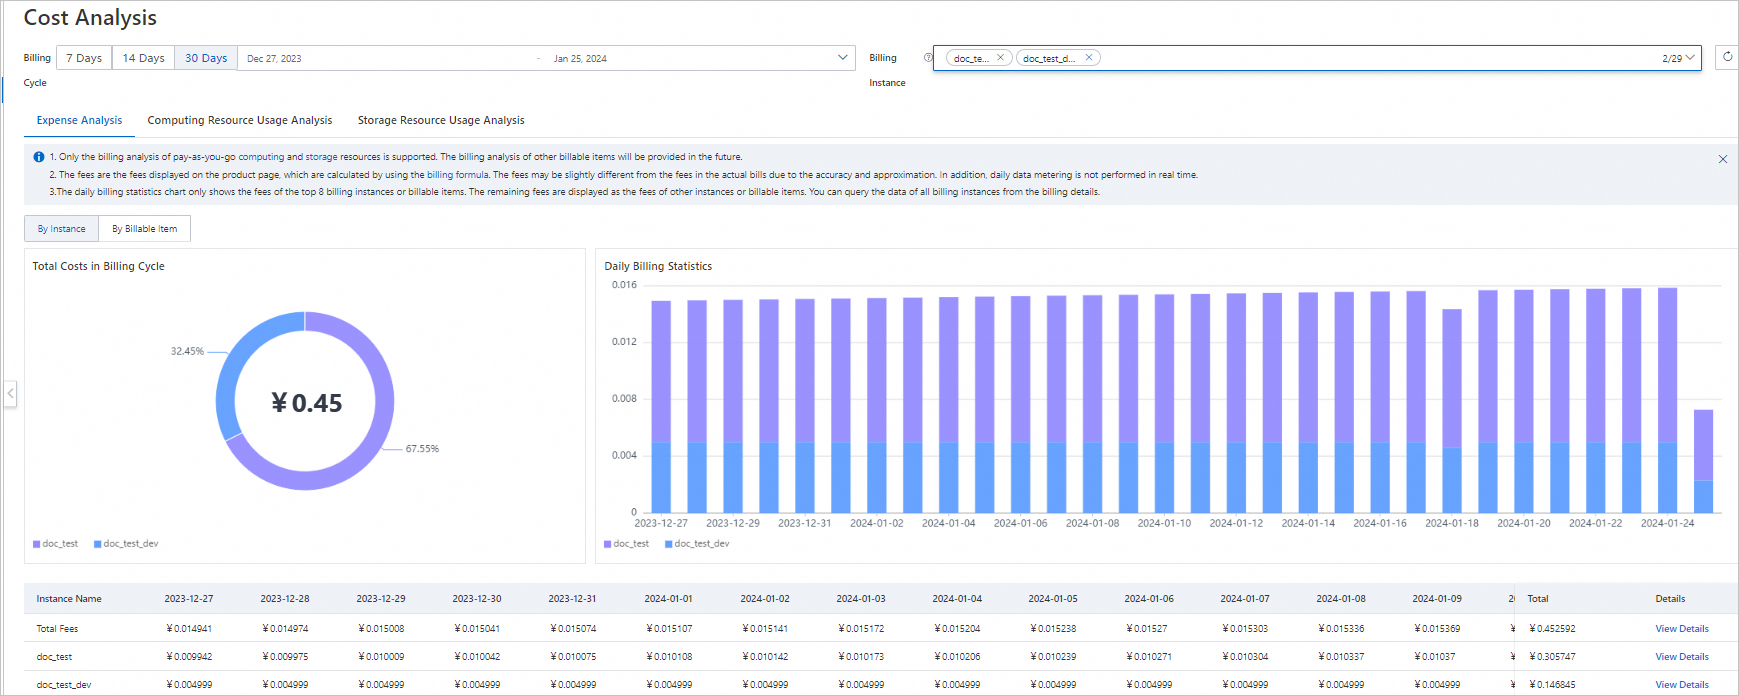
Total Costs in Billing Cycle: displays the total expense in a specified billing cycle in a pie chart. You can move the pointer over the pie chart to obtain the percentages of the expenses of the top N instances (at most top 7 instances) and other instances. Take note that the data may be slightly different from the data in bills due to low precision and the use of approximate values.
Daily Billing Statistics: displays daily expenses from the start date to the end date in a specified billing cycle in a stacked column chart. You can move the pointer over each column in the chart and view the expenses and percentages of the top N instances (at most top 7 instances) and other instances for a specified date in descending order. You can quickly learn about the daily expense change trends of one or more instances based on the chart.
Details: displays the daily expenses and total expenses of each instance in a billing cycle in a list. You can also click View Details in the Detail column of an instance and view the expenses and the expense percentages of each billable item in the instance. This allows you to quickly locate the billable item for which the highest expenses are incurred.
Analyze expenses by billable item:
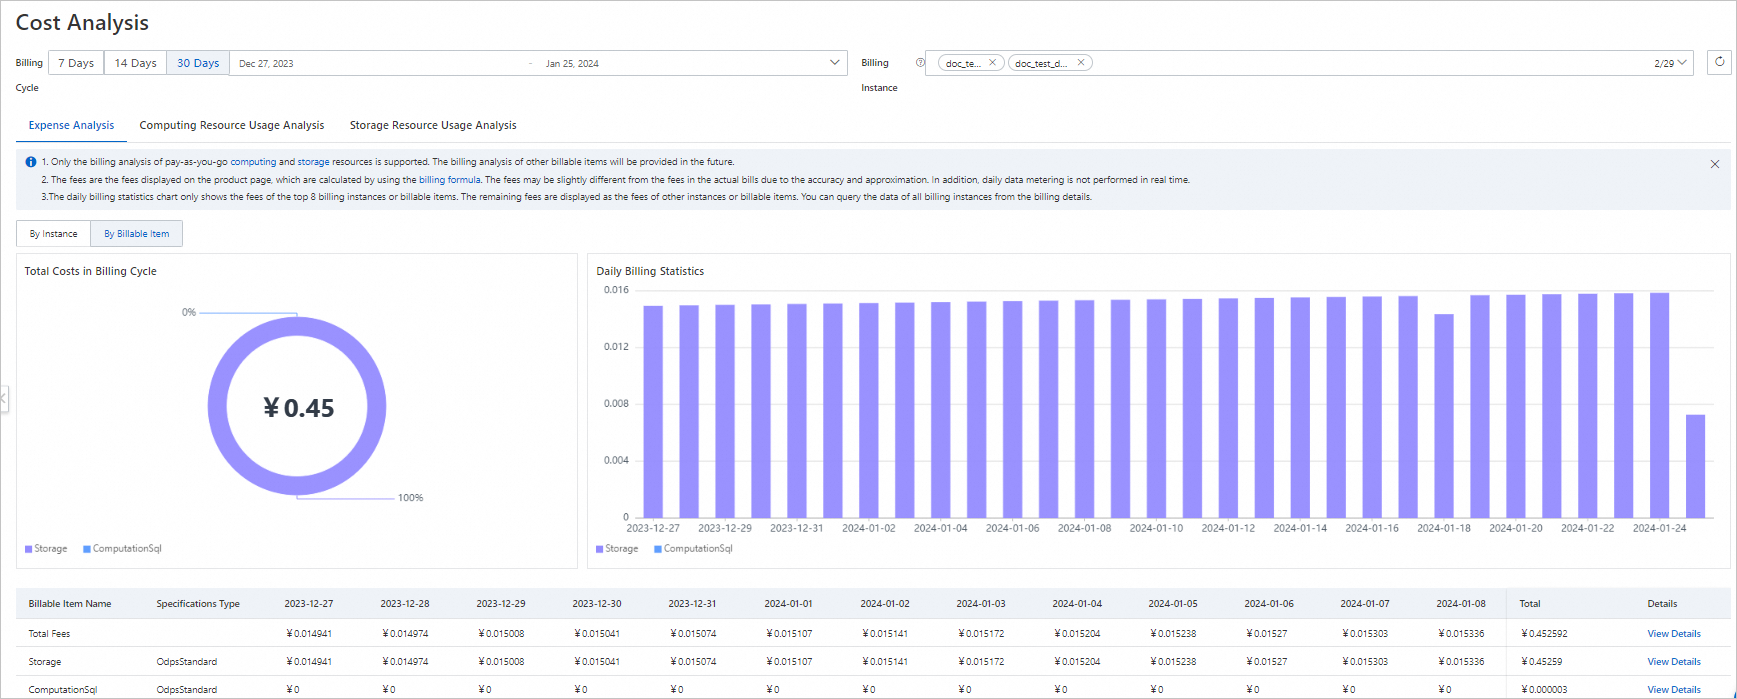
Total Costs in Billing Cycle: displays the total expense in a specified billing cycle in a pie chart. You can move the pointer over the pie chart to quickly obtain the percentages of the expenses for the top N billable items (at most top 7 billable items) and other billable items. Take note that the data may be slightly different from the data in bills due to low precision and the use of approximate values.
Daily Billing Statistics: displays daily expenses from the start date to the end date in a specified billing cycle in a stacked column chart. You can move the pointer over each column in the chart and view the expenses and percentages of the top N billable items (at most top 7 billable items) and other billable items for a specified date in descending order. You can quickly obtain the daily expense change trends of each billable item for the instances that you specify in Billing Instance based on the chart.
Details: displays the daily expenses and total expenses of each billable item in a billing cycle in a list. You can also click View Details in the Detail column of a billable item and view the distribution of instance expenses in the expenses of each billable item and expenses and percentages of each instance. This allows you to quickly locate the instance with the highest expenses in terms of a specific billable item.
NoteValues of Specification Type in Details:
OdpsStandard: the pay-as-you-go resource package. For more information, see Pay-as-you-go.
OdpsSpot: the pay-as-you-go spot resource package. For more information, see Spot Edition.
OdpsPlusStandard: the subscription resource package. For more information, see Subscription.
The names of billable items on the Expense Analysis tab are the same as the names of types in metering usage records and different from those on the Billing Details page. The following table describes the mappings between the names of billable items on the Expense Analysis tab and the names and codes of billable items on the Billing Details page.
Billable item name on Expense Analysis
Billable item name on Billing Details
Billable item code on Billing Details
ComputationSql
SQL Computation
Spot SQL Job
odps_computation
odps_computation_sql_spot
ComputationSqlOTS
Tablestore External Tables
Spot Job with Tablestore External Table
mc_external_table_ots
odps_external_table_ots_spot
ComputationSqlOSS
OSS External Tables
Spot Job with OSS External Table
mc_external_table_oss
odps_external_table_oss_spot
spark
Spark Computation
Spot Spark Job
odps_computation_spark
odps_computation_mars_spot
mars
Mars (Pay-as-you-go)
Spot Mars Computation
odps_computation_mars
odps_computation_mars_spot
MapReduce
MapReduce Computation
Spot MapReduce Computation
CUUsage
odps_computation_mr_spot
Storage
Storage
Storage
RecycleBinStorage
RecycleBinStorage
RecycleBinStorage
Computing resource usage analysis
On the Cost Analysis page, click the Computing Resource Usage Analysis tab.
On the Computing Resource Usage Analysis tab, perform the relevant analysis.
The following metering types are involved in computing resource usage data:
ComputationSql: the metering data of SQL jobs that involve internal tables.
ComputationSqlOTS: the metering data of SQL jobs that involve Tablestore external tables.
ComputationSqlOSS: the metering data of SQL jobs that involve OSS external tables.
MapReduce: the metering data of MapReduce jobs.
spark: the metering data of Spark jobs.
mars: the metering data of Mars jobs.
Number of Usage Records:
Displays the trend of the total number of records of each data type in the usage records in a line chart. In most cases, the number of usage records can also be considered as the number of jobs. If a job is associated with an internal table and an external table, two usage records are generated for the job.
Computing Resource Usage:
Displays the trend of the computing resource usage of each type of job in a line chart. The computing resource usage is calculated based on the following items:
Amount of scanned data in the unit of GB. For the jobs whose metering types are ComputationSql, ComputationSqlOTS, or ComputationSqlOSS, they are billed based on the amount of scanned data. The computing resource usage of such a job is calculated by using the following formula:
Amount of scanned data × Complexity. The complexity is fixed at 1 for the jobs whose metering types are ComputationSqlOTS or ComputationSqlOSS.CU-hours. For the jobs whose metering types are MapReduce, spark, or mars, they are billed based on CU-hours.
Usage details list:
The detailed job usage is displayed in a list. By default, jobs are listed based on the computing resource usage in descending order. This allows you to quickly obtain the top N jobs that consume most computing resources. You can view the information about a single job in terms of instances. You can also view job information with the same script in terms of signatures. The signatures of the jobs for which the same script is executed are the same.
View job details by instance ID:
The list contains the following information: Instance ID, Specifications Type, Metering Type, Job Owner, Project, Submitted At, End Time, Signature, and Computing Resource Usage.
Click the desired instance ID to go to the Jobs page and view more information about the job.
Specifications Type specifies the resource package that you select when you purchase the MaxCompute service.
OdpsStandard: the pay-as-you-go resource package. For more information, see Pay-as-you-go.
OdpsSpot: the pay-as-you-go spot resource package. For more information, see Spot Edition.
OdpsPlusStandard: the subscription resource package. For more information, see Subscription.
View job details by signature:
The list contains the following information: Signature, IncludedInstance ID, and Total Computing Resource Usage.
You can move the pointer over the IncludedInstance ID column of the desired signature. All instance IDs are displayed. You can click a specific ID to go to the Jobs page and view more information about the job.
Storage resource usage analysis
On the Cost Analysis page, click the Storage Resource Usage Analysis tab.
On the Storage Usage Analysis tab, analyze the storage resource usage.
Storage Trend(GB):
Displays the trend of the storage resource usage of one or more instances in a specified billing cycle in a line chart. The storage resource usage data includes the total storage resource usage, standard storage resource usage, and backup storage resource usage.
Instance Storage Resource Usage(GB):
Displays the trend of the daily total storage resource usage, daily standard storage resource usage, and daily backup storage resource usage for each instance in a stacked column chart.
Usage details list:
Displays the details about the daily total storage resource usage, daily standard storage resource usage, and daily backup storage resource usage in a list.
References
For more information about cost optimization and resource utilization improvement, see Optimization of computing resource configuration.