Request-level metrics provide detailed insights into each function invocation and help you monitor the execution status of functions. You can use request-level metrics to quickly identify and locate issues, analyze application bottlenecks, and better manage and optimize your function applications.
What are request-level metrics
Request-level metrics summarize the execution status of a function at the request level. When you enable this feature, the system collects metrics for each function execution, such as performance, exception, and tracing metrics. These metrics are then delivered to the Logstore that you specify in the log configuration.
Performance metrics: memory usage, function running time, initialization time, and cold start information.
Exception metrics: execution failures and error details.
Tracing metrics: the running time of key system links, the sampling status of integrated tracing, and details for HTTP functions, such as the path, status code, and client IP address.
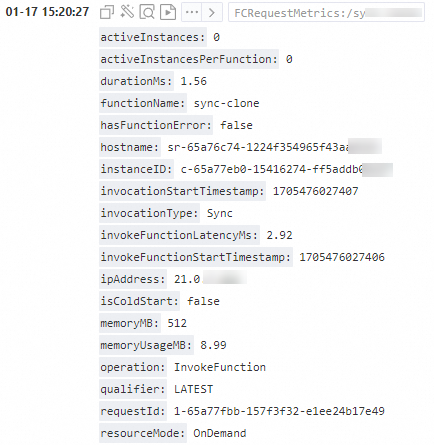
When you enable request-level metrics, Function Compute delivers the execution metrics for each request to your Logstore. The following figure shows an example.
Scenarios
View function execution details, performance metrics, and error messages.
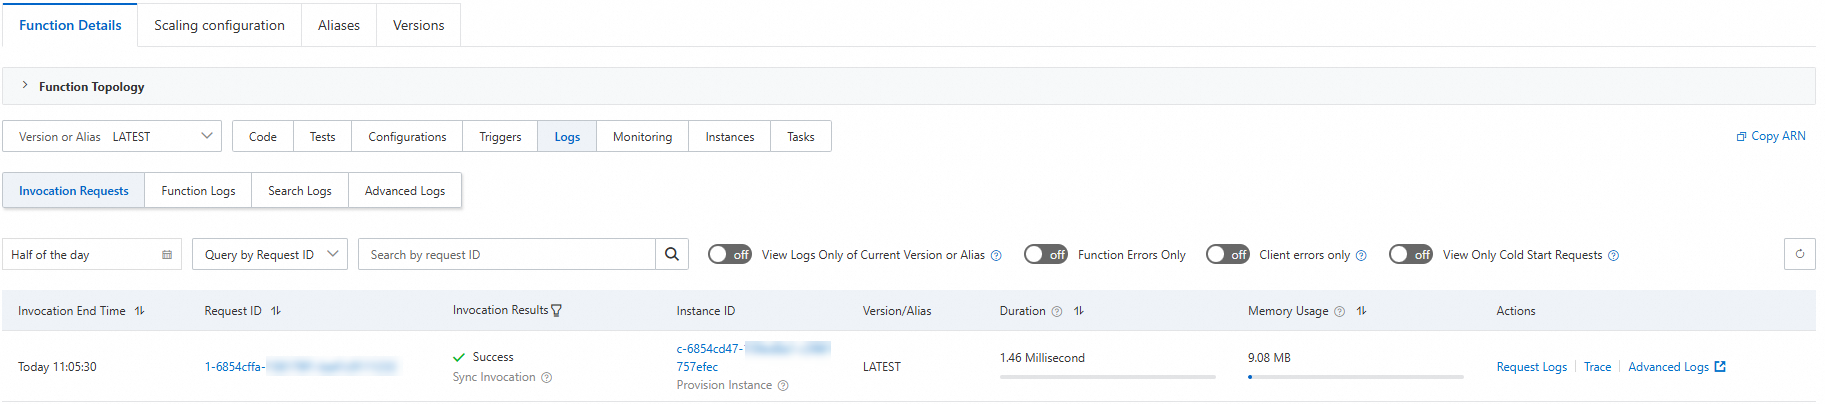
The console displays a request list based on request-level metrics. On this page, you can view the details of each request, including the execution status, instance ID, running time, memory usage, and request log. The following figure shows an example.
 Note
NoteYou can still view the request list if request-level metrics are disabled. However, the list may be inaccurate in the following scenarios:
If the same request ID appears multiple times, you cannot locate the log for a specific request. This issue often occurs in retry scenarios for asynchronous invocations.
In custom runtimes and custom image runtimes, if
FC Invoke Start RequestId: xxxandFC Invoke End RequestId: xxxare logged, a single invocation may appear twice in the request list.
Perform custom searches and create custom dashboards.
Request metrics are delivered to your Logstore in a
key:valueformat. You can create custom dashboards to meet your business requirements. For more information, see Create a dashboard.
Notes
Scope
Request-level metric logging is a function-level configuration. After you enable this feature, it applies to the current function, and a log is recorded for each function execution.
Pricing
Log storage fees are incurred when logs are delivered to Simple Log Service (SLS). For more information about the pricing of SLS, see Pricing.
Enable request-level metrics
Enable request-level metrics in the console
Prerequisites
Function Compute
Simple Log Service (SLS)
Procedure
Log on to the Function Compute console. In the navigation pane on the left, click Functions.
In the top navigation bar, select a region. On the Functions page, click the function to manage.
On the function details page, click the Configurations tab.
Find Advanced Configuration and click Edit. In the Advanced Configuration panel, find the Log area, enable instance-level metrics, and click Deploy.
The following table describes the main parameters. You can use the default values for other parameters.
Parameter
Description
Example
Logging
Specifies whether to store function invocation logs in Simple Log Service (SLS). For more information about the logging feature, see Configure logging.
Enable
Project
Select a configured project.
aliyun-fc-hangzhou-2238f0df-a742-524f-9f90-976ba*******
Logstore
Select a configured Logstore.
function-log
Log Segmentation Rule
Specifies whether to enable the log segmentation rule. If enabled, Function Compute splits logs into multiple segments according to the rule and writes them to Simple Log Service one by one.
Enable
Request-level Metrics
Specifies whether to view request-level metrics. If you enable this feature, metrics for each function invocation are collected and delivered to the Logstore that you select in the log configuration.
Enable
Instance-level Metrics
Specifies whether to enable instance-level metrics. If you enable this feature, the metric data of function instances is delivered to the Logstore that you select in the log configuration.
Enable
Enable request-level metrics using Serverless Devs
Prerequisites
Procedure
Create a code directory. The following example shows the directory structure:
.
├── code
│   └── index.js
└── s.yaml
The following code provides an example of an s.yaml file:
In this example, the enableRequestMetrics field is used to enable request-level metrics. Before you enable this feature, you must enable logging and set the logstore and project fields to an existing Logstore and project in your account.
edition: 3.0.0
name: hello-world-app
access: "default"
vars: # Global variables
  region: "cn-hangzhou"

resources:
  hello_world:
    component: fc3 # Component name
    props:
      region: ${vars.region}
      functionName: "start-nodejs-****"
      description: 'hello world by serverless devs'
      runtime: "nodejs16"
      code: ./code
      handler: index.handler
      memorySize: 128
      timeout: 30
      logConfig: # Change the values of logstore and project to your actual Logstore and project. You can also set logConfig to auto to automatically create a project and a Logstore.
        enableInstanceMetrics: true
        enableRequestMetrics:  true  # The switch for request-level metrics. After you enable this feature, the system collects metrics for each function execution.
        logBeginRule: DefaultRegex
        logstore: 'your-logstore'
        project: 'your-project'
Run the following command to deploy the application.
sudo s deploy -yAfter the deployment is successful, you can log on to the Function Compute console to verify that request-level metrics are enabled for the function.
Log query
Log format
The topic of a request-level metric log follows the format: FCRequestMetrics:/functionName. You can use the query statement __topic__: "FCRequestMetrics:/functionName" in SLS to filter all request-level metric logs. For more information, see Quick start for log query and analysis.
Metric fields
Request-level metrics include the following fields.
Metric | Description | Example | Recorded for each invocation? |
functionName | The function name. | my-function | Yes |
versionId | The version name. | 12 | Yes |
qualifier | The service alias. The default value is LATEST. | prod | Yes |
requestId | The request ID. | db72ce53-ccbe-4216-af55-642622e01494 | Yes |
operation | The action name. | InvokeFunction | Yes |
invocationType | The invocation type. Valid values: Sync: synchronous call Async: asynchronous invocation | Sync | Yes |
memoryMB | The memory limit of the function. | 512 | Yes |
memoryUsageMB | The memory consumed by the function execution. | 410 | Yes |
durationMs | The request running time. | 20.20 | Yes |
isColdStart | Indicates whether the request is a cold start. Note When a request arrives at Function Compute, if no running function instance is available to process the request, the system needs to create an instance, download the code, and start the execution environment. A request that goes through the complete process of instance creation, code download, and environment startup within its lifecycle is called a cold start request. The Function Compute platform has many optimizations to mitigate cold starts. To avoid cold starts, the platform creates instances in advance. When a request arrives, it might be processed by an already-created instance during the instance creation process. Such a request is not considered a cold start request. | false | Yes |
instanceEvent | The instance event. Currently, only ColdStart is supported, which is recorded for cold start requests. | ColdStart | No |
hasFunctionError | Indicates whether a function error occurred during the function execution. | false | Yes |
errorType | The type of the function error. Valid values:
| FunctionUnhandledError | No. This metric is recorded only when a function error occurs, which is when |
invokeFunctionLatencyMs | The function running time. | 99.00 | Yes. This metric is always recorded. |
traceContext | The trace context information. | 371d3ff242fcee9:371d3ff242fcee9:0:1 | No. This metric is recorded only when tracing is configured. |
isSampled | Indicates whether the request is sampled by Tracing Analysis. | true | No. This metric is recorded only when tracing is configured. |
resourceMode | The type of instance that processes the request. Valid values:
| OnDemand | Yes |
instanceID | The instance ID. | c-65603d8c-37e1bf7123054a77**** | Yes |
hostname | The instance host. | c-65603d8c-37e1bf7123054a77**** | Yes |
ipAddress | The IP address of the instance. Note: This is the internal IP address of the instance, used to distinguish between different instances. It is not the public IP address of the instance. | 21.0.XX.XX | Yes |
activeInstances | The number of active instances. | 1 | Yes |
activeInstancesPerFunction | The number of active instances for the current function. | 1 | Yes |
scheduleLatencyMs | The scheduling latency. The scheduling latency is relatively long for cold start requests. | 10.07 | Yes |
coldStartStartTimestamp | The UNIX timestamp when the cold start begins. | 1700806029167 | No. This metric is recorded only when a cold start occurs. |
coldStartLatencyMs | The cold start latency. | 487.65 | No. This metric is recorded only when a cold start occurs. |
prepareCodeStartTimestamp | The UNIX timestamp when code download begins. This is a 13-digit timestamp that is accurate to the millisecond. | 1700806029167 | No. This metric is recorded only when a cold start occurs. |
prepareCodeLatencyMs | The time taken to download the code. | 0.18 | No. This metric is recorded only when a cold start occurs. |
runtimeInitializationStartTimestamp | The UNIX timestamp when runtime initialization begins. | 1700806029168 | No. This metric is recorded only when a cold start occurs. |
runtimeInitializationMs | The time taken to initialize the runtime. | 487.37 | No. This metric is recorded only when a cold start occurs. |
asyncAttemptStartTimestamp | By default, a failed asynchronous function invocation is retried three times. This parameter is the start timestamp of the ${retryCount}th retry. | 1700806028084 | No. This metric is recorded only for asynchronous invocations. |
asyncAttemptLatencyMs | By default, a failed asynchronous function invocation is retried three times. This parameter is the duration of the ${retryCount}th retry. | 1688.74 | No. This metric is recorded only for asynchronous invocations. |
asyncMode | The asynchronous invocation mode. Valid values:
| Stateful | No. This metric is recorded only for asynchronous invocations. |
retryCount | The number of retries. | 0 | No. This metric is recorded only for asynchronous invocations. |
Retrieve logs
You must configure indexes to retrieve logs. The Function Compute console automatically configures the required indexes for you. After the indexes are configured, you can run SQL statements in the corresponding Logstore in the SLS console to retrieve and filter request logs. You can specify a topic to limit the search scope to request-level metric logs.
For example, to query requests whose running time exceeds 1 second, you can run the following SQL statement:
__topic__: "FCRequestMetrics:/f1" AND qualifier: q1 and operation: InvokeFunction and durationMs>1000For more information about complex query syntax, see Guide to log query and analysis.
Create a custom dashboard
If you want to create a chart where the x-axis represents time (t) and the y-axis represents a metric value, you can run the following SQL statement:
__topic__: "FCRequestMetrics:/f1" AND qualifier: q1 and operation: InvokeFunction | select __time__ - __time__ % 60 as t, count(*) as invocations, avg(durationMs) as avgDurationMs group by t order by t For more information about how to create custom dashboards, see Create a dashboard.