This topic describes the observability metrics of asynchronous tasks, including the task dashboard, task execution list, and task monitoring metrics.
Task dashboard
You can view the task dashboard on the Task page in the Function Compute console.

The following task monitoring data is displayed on the task dashboard.
| Monitoring item | Description |
|---|---|
| Submitted Tasks | Displays the number of tasks that are submitted in the last one minute, including the tasks in the running, completed, and enqueued states. |
| Completed Tasks | Displays the number of tasks that are completed in the last one minute, including successful and failed tasks. |
| Queuing Tasks | Displays the number of tasks that are in the queue. If the value of this metric is not zero, a task backlog occurs. |
| Running Tasks | Displays the number of tasks that are being executed. |
| Failed Tasks | Displays the number of tasks that failed in the last one minute. |
| Running Instances | Displays the number of instances that are executing tasks. |
Task execution list
On the Task page of the Function Compute console, click a function to view the asynchronous tasks, as shown in the following figure.

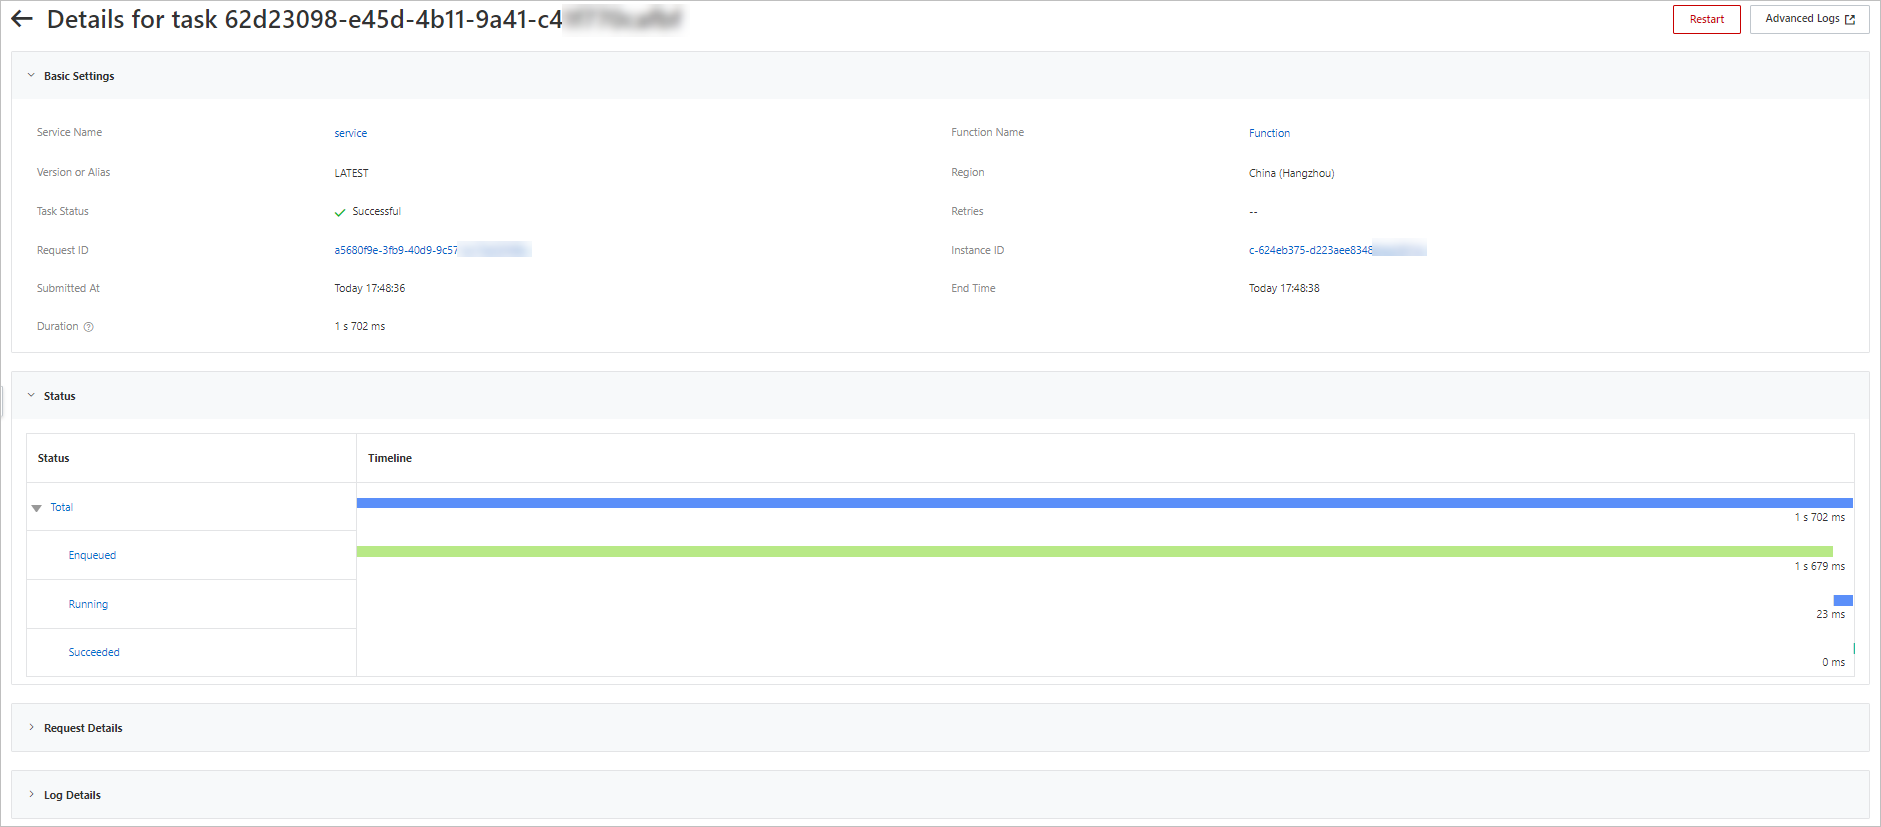
You can click a task ID in the Task ID column to view the Basic Settings, Status, Request Details, and Log Details of the task, as shown in the following figure.

Metrics
You can log on to the Function Compute console. On the Metrics tab of the desired function, view the metrics related to asynchronous invocations
and the resource usage of the asynchronous tasks at the instance level. For more information
about the metrics, see Metrics.
- Click the Function Metrics tab to view the metrics related to asynchronous invocations, as shown in the following
figure.

- Click the Instance Metrics tab to view the resource usage of the asynchronous task at the instance level, as
shown in the following figure.
