If your business data is stored in PolarDB-X 1.0 and you want to perform full-text searches and semantic analytics on the data, you can use Alibaba Cloud Elasticsearch and Alibaba Cloud Logstash. This topic describes how to use Alibaba Cloud Logstash to synchronize data from PolarDB-X 1.0 to Alibaba Cloud Elasticsearch in real time.
Background information
Alibaba Cloud Logstash is a powerful data processing tool that you can use to collect, transform, optimize, and generate data. Alibaba Cloud Logstash provides the logstash-input-jdbc plug-in, which is installed on Logstash clusters by default and cannot be removed. The plug-in can query multiple data records in PolarDB-X 1.0 at a time and synchronize the data records to Alibaba Cloud Elasticsearch. The plug-in uses a round-robin method to identify the most recently inserted or updated data records in PolarDB-X 1.0 on a regular basis and synchronizes the data records to Alibaba Cloud Elasticsearch. If you want to synchronize full data and can accept latency of a few seconds, or you want to query specific data at a time and synchronize the data, you can use Alibaba Cloud Logstash.
Prerequisites
A PolarDB-X 1.0 instance, an Alibaba Cloud Elasticsearch cluster, and an Alibaba Cloud Logstash cluster are created. In addition, a database is created in the PolarDB-X 1.0 instance. We recommend that you create the PolarDB-X 1.0 instance, Elasticsearch cluster, and Logstash cluster in the same virtual private cloud (VPC).
For more information about how to create a PolarDB-X 1.0 instance and create a database in the instance, see Create a PolarDB-X 1.0 instance.
For more information about how to create an Alibaba Cloud Elasticsearch cluster, see Create an Alibaba Cloud Elasticsearch cluster. In this example, an Elasticsearch V6.7 cluster of the Standard Edition is created.
For more information about how to create an Alibaba Cloud Logstash cluster, see Create an Alibaba Cloud Logstash cluster.
NoteIf you want to use Logstash to collect data from the Internet or transfer collected data to the Internet, you must configure a Network Address Translation (NAT) gateway and use the gateway to connect your Logstash cluster to the Internet. For more information, see Configure a NAT gateway for data transmission over the Internet.
Limits
The values of the _id field in the Elasticsearch cluster must be the same as the values of the id field in the PolarDB-X 1.0 database.
This condition ensures that the data synchronization task can establish a mapping between data records in the PolarDB-X 1.0 database and documents in the Elasticsearch cluster. If you update a data record in the PolarDB-X 1.0 database, the data synchronization task uses the updated data record to overwrite the document that has the same ID in the Elasticsearch cluster.
NoteIn essence, an update operation in Elasticsearch deletes the original document and indexes the new document. Therefore, the overwrite operation is as efficient as an update operation performed by the data synchronization task.
If you insert a data record into or update a data record in the PolarDB-X 1.0 database, the data record must contain a field that indicates the time when the data record is inserted or updated.
Each time the logstash-input-jdbc plug-in performs a round robin, the plug-in records the time when the last data record in the round robin is inserted into or updated in the PolarDB-X 1.0 database. Logstash synchronizes only data records that meet the following requirements from the PolarDB-X 1.0 database: The time when the data records are inserted into or updated in the PolarDB-X 1.0 database is later than the time when the last data record in the previous round robin is inserted into or updated in the PolarDB-X 1.0 database.
ImportantIf you delete data records in the PolarDB-X 1.0 database, the logstash-input-jdbc plug-in cannot delete the documents that have the same IDs from the Elasticsearch cluster. To delete the documents from the Elasticsearch cluster, you must run the related command on the Elasticsearch cluster.
Procedure
Step 1: Make preparations
Create a table in the PolarDB-X 1.0 database and prepare test data in the table.
In this example, the following statement is used to create a table:
CREATE table food(
  id int PRIMARY key AUTO_INCREMENT,
  name VARCHAR (32),
  insert_time DATETIME,
  update_time DATETIME
);
The following statements are used to insert data into the table:
INSERT INTO food values(null,'Chocolates',now(),now());
INSERT INTO food values(null,'Yogurt',now(),now());
INSERT INTO food values(null,'Ham sausage',now(),now());
Enable the Auto Indexing feature for the Elasticsearch cluster. For more information, see Access and configure an Elasticsearch cluster.
In the Logstash cluster, upload an SQL JDBC driver whose version is compatible with the version of the PolarDB-X 1.0 database. For more information, see Configure third-party libraries. In this example, the mysql-connector-java-5.1.35 driver is used.
NoteIn this example, a MySQL JDBC driver is used to connect to the PolarDB-X 1.0 database. You can also use a PolarDB JDBC driver to connect to the PolarDB-X 1.0 database. However, for a PolarDB-X 2.0 database, a PolarDB JDBC driver may not work. We recommend that you use a MySQL JDBC driver.
Obtain the IP addresses of the nodes in the Logstash cluster on the Basic Information page of the Logstash cluster in the Elasticsearch console. Then, add the IP addresses to the IP address whitelist of the PolarDB-X 1.0 instance. For more information, see Set an IP address whitelist.
Step 2: Configure a Logstash pipeline
- Go to the Logstash Clusters page of the Alibaba Cloud Elasticsearch console.
- Navigate to the desired cluster.
- In the top navigation bar, select the region where the cluster resides.
- On the Logstash Clusters page, find the cluster and click its ID.
- In the left-side navigation pane, click Pipelines.
- On the Pipelines page, click Create Pipeline.
On the Create Task page, enter a pipeline ID in the Pipeline ID field and enter the required configurations in the Config Settings field.
In this example, the following configurations are entered in the Config Settings field:
input { jdbc { jdbc_driver_class => "com.mysql.jdbc.Driver" jdbc_driver_library => "/ssd/1/share/<Logstash cluster ID>/logstash/current/config/custom/mysql-connector-java-5.1.35.jar" jdbc_connection_string => "jdbc:mysql://drdshbga51x6****.drds.aliyuncs.com:3306/<Database name>?useUnicode=true&characterEncoding=utf-8&useSSL=false&allowLoadLocalInfile=false&autoDeserialize=false" jdbc_user => "db_user" jdbc_password => "db_password" jdbc_paging_enabled => "true" jdbc_page_size => "50000" statement => "select * from food where update_time >= :sql_last_value" schedule => "* * * * *" record_last_run => true last_run_metadata_path => "/ssd/1/<Logstash cluster ID>/logstash/data/last_run_metadata_update_time.txt" clean_run => false tracking_column_type => "timestamp" use_column_value => true tracking_column => "update_time" } } filter { } output { elasticsearch { hosts => "http://es-cn-n6w1o1x0w001c****.elasticsearch.aliyuncs.com:9200" user => "elastic" password => "es_password" index => "drds_test" document_id => "%{id}" } }NoteYou must replace
<Logstash cluster ID>in the preceding code with the ID of the Logstash cluster that you use. For more information about how to obtain the ID, see Overview of the Logstash Clusters page.Table 1. Parameters in the input part Parameter
Description
jdbc_driver_class
The class of the JDBC driver.
jdbc_driver_library
The path of the JDBC driver file. For more information, see Configure third-party libraries.
jdbc_connection_string
The JDBC connection string that is used to connect to the PolarDB-X 1.0 database. The JDBC connection string contains the endpoint, port number, and name of the PolarDB-X 1.0 database.
jdbc_user
The username that is used to access the PolarDB-X 1.0 database.
jdbc_password
The password that is used to access the PolarDB-X 1.0 database.
jdbc_paging_enabled
Specifies whether to enable paging. Default value: false.
jdbc_page_size
The number of entries per page.
statement
The SQL statement.
schedule
The interval at which the SQL statement is executed. The value
* * * * *indicates that the SQL statement is executed at intervals of 1 minute.record_last_run
Specifies whether to record the last execution result. If this parameter is set to true, the value of tracking_column in the last execution result is stored in the file in the path specified by using the last_run_metadata_path parameter.
last_run_metadata_path
The path of the file that contains the last execution time. A file path is provided at the backend. The path is in the /ssd/1/<Logstash cluster ID>/logstash/data/ format. After you specify a path, Logstash automatically generates a file in the path, but you cannot view the data in the file.
clean_run
Specifies whether to clear the path that is specified by the last_run_metadata_path parameter. Default value: false. If this parameter is set to true, each query starts from the first entry in the database.
use_column_value
Specifies whether to record the values of a specific column.
tracking_column_type
The type of the column whose values you want to track. Default value: numeric.
tracking_column
The column whose values you want to track. The values must be sorted in ascending order. In most cases, this column is the primary key of the table.
Table 2. Parameters in the output part Parameter
Description
hosts
The URL that is used to access the Elasticsearch cluster. Specify the URL in the following format: http://<Internal endpoint of the Elasticsearch cluster>:9200. You can obtain the internal endpoint from the Basic Information page of the cluster. For more information, see View the basic information of a cluster.
user
The username that is used to access the Elasticsearch cluster. The default username is elastic.
password
The password of the elastic account. The password of the elastic account is specified when you create the Elasticsearch cluster. If you forget the password, you can reset it. For more information about the procedure and precautions for resetting the password, see Reset the access password for an Elasticsearch cluster.
index
The name of the index in the Elasticsearch cluster.
document_id
The IDs of documents in the Elasticsearch cluster. Set this parameter to %{id}, which indicates that the IDs of documents are the same as the IDs of data records in the PolarDB-X 1.0 database.
ImportantThe preceding configurations are based on test data. You can configure the pipeline based on your business requirements. For more information about other parameters supported by the input plug-in, see Logstash Jdbc input plugin.
If your configurations contain a parameter similar to
last_run_metadata_path, the file path must be provided by Alibaba Cloud Logstash. A path in the/ssd/1/<Logstash cluster ID>/logstash/data/format is provided at the backend and is available for tests. The system does not delete the data in this path. Make sure that your disk has sufficient storage space when you use this path. After you specify a path, Logstash automatically generates a file in the path, but you cannot view the data in the file.For security purposes, if you specify a JDBC driver when you configure a pipeline, you must add
allowLoadLocalInfile=false&autoDeserialize=falseat the end of thejdbc_connection_stringparameter, such asjdbc_connection_string => "jdbc:mysql://drdshbga51x6****.drds.aliyuncs.com:3306/<Database name>?allowLoadLocalInfile=false&autoDeserialize=false". Otherwise, when you add a configuration file for the Logstash pipeline, the system displays an error message that indicates a check failure.
For more information about how to configure parameters in the Config Settings field, see Logstash configuration files.
- Click Next to configure pipeline parameters.
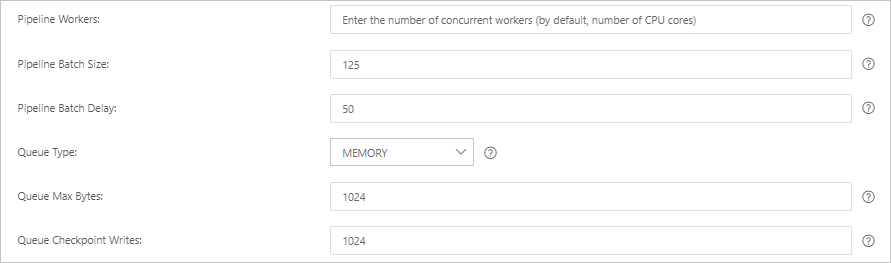
Parameter Description Pipeline Workers The number of worker threads that run the filter and output plug-ins of the pipeline in parallel. If a backlog of events exists or some CPU resources are not used, we recommend that you increase the number of threads to maximize CPU utilization. The default value of this parameter is the number of vCPUs. Pipeline Batch Size The maximum number of events that a single worker thread can collect from input plug-ins before it attempts to run filter and output plug-ins. If you set this parameter to a large value, a single worker thread can collect more events but consumes larger memory. If you want to make sure that the worker thread has sufficient memory to collect more events, specify the LS_HEAP_SIZE variable to increase the Java virtual machine (JVM) heap size. Default value: 125. Pipeline Batch Delay The wait time for an event. This time occurs before you assign a small batch to a pipeline worker thread and after you create batch tasks for pipeline events. Default value: 50. Unit: milliseconds. Queue Type The internal queue model for buffering events. Valid values: - MEMORY: traditional memory-based queue. This is the default value.
- PERSISTED: disk-based ACKed queue, which is a persistent queue.
Queue Max Bytes The value must be less than the total capacity of your disk. Default value: 1024. Unit: MB. Queue Checkpoint Writes The maximum number of events that are written before a checkpoint is enforced when persistent queues are enabled. The value 0 indicates no limit. Default value: 1024. Warning After you configure the parameters, you must save the settings and deploy the pipeline. This triggers a restart of the Logstash cluster. Before you can proceed, make sure that the restart does not affect your services. - Click Save or Save and Deploy.
- Save: After you click this button, the system stores the pipeline settings and triggers a cluster change. However, the settings do not take effect. After you click Save, the Pipelines page appears. On the Pipelines page, find the created pipeline and click Deploy in the Actions column. Then, the system restarts the Logstash cluster to make the settings take effect.
- Save and Deploy: After you click this button, the system restarts the Logstash cluster to make the settings take effect.
Step 3: Verify the result
Log on to the Kibana console of the Elasticsearch cluster.
For more information, see Log on to the Kibana console.
In the left-side navigation pane, click Dev Tools.
On the Console tab of the page that appears, run the following command to view the number of indexes that store the synchronized data:
GET drds_test/_count
{
  "query": {"match_all": {}}
}
If the command is successfully run, the following result is returned:
{
  "count" : 3,
  "_shards" : {
    "total" : 1,
    "successful" : 1,
    "skipped" : 0,
    "failed" : 0
  }
}
Update data in the table and insert data into the table.
UPDATE food SET name='Chocolates',update_time=now() where id = 1;
INSERT INTO food values(null,'Egg',now(),now());
In the Kibana console, view the updated and inserted data.
Query the data record in which the value of name is Chocolates.
GET drds_test/_search
{
  "query": {
    "match": {
      "name": "Chocolates"
   }}
}
If the command is successfully run, the result shown in the following figure is returned.

Query all data.
GET drds_test/_search
{
  "query": {
    "match_all": {}
  }
}
If the command is successfully run, the result shown in the following figure is returned.
