When microservices communicate through dozens of APIs, identifying which API is slow or failing -- and whether the root cause is a database query, a downstream dependency, or the API itself -- requires correlated metrics across the entire call chain. Service and API monitoring automatically detects API calls in your applications and surfaces performance data, dependency maps, and trace-level detail so you can move from symptom to root cause without switching tools.
With this feature, you can:
Pinpoint slow or failing APIs. Sort APIs by response time, request volume, error count, or exception count to prioritize investigation.
Trace slow responses to database queries. View the SQL and NoSQL statements executed within an API call, with execution time and full trace context.
Map service dependencies. Visualize upstream and downstream call topologies with per-service metrics to isolate whether a bottleneck is in your application or a dependent service.
Inspect individual requests. Click any TraceId to view the full distributed trace, including exception stacks, HTTP errors, and call timing.
Supported frameworks
Service and API monitoring automatically detects APIs in the following web and remote procedure call (RPC) frameworks. No manual instrumentation is required.
Web frameworks
| Framework | Minimum version |
|---|---|
| Tomcat | 7+ |
| Jetty | 8+ |
| Resin | 3.0+ |
| Undertow | 1.3+ |
| WebLogic | 11.0+ |
| SpringBoot | 1.3.0+ |
RPC frameworks
| Framework | Minimum version |
|---|---|
| HSF | 2.0+ |
| Dubbo | 2.5+ |
Feature availability by edition
Some monitoring capabilities require Professional Edition or Platinum Edition and are not available in Standard Edition.
| Feature | Standard | Professional | Platinum |
|---|---|---|---|
| API list with sort and filter | Yes | Yes | Yes |
| Call topology visualization | -- | Yes | Yes |
| SQL and NoSQL analysis | -- | Yes | Yes |
| Exception analysis | -- | Yes | Yes |
| Error analysis | -- | Yes | Yes |
| Upstream and downstream service details | -- | Yes | Yes |
Open service monitoring
Log on to the EDAS console.
In the left-side navigation pane, choose Application Management > Applications.
In the top navigation bar, select a region. In the upper part of the page, select a microservice namespace. From the Cluster Type drop-down list, select Kubernetes Cluster.
Find the target application and click its name in the Application Name column.
In the left-side navigation pane of the application details page, choose Monitor > Service Details.
Identify slow or failing APIs
The Overview tab lists all APIs that Application Real-Time Monitoring Service (ARMS) automatically detects.
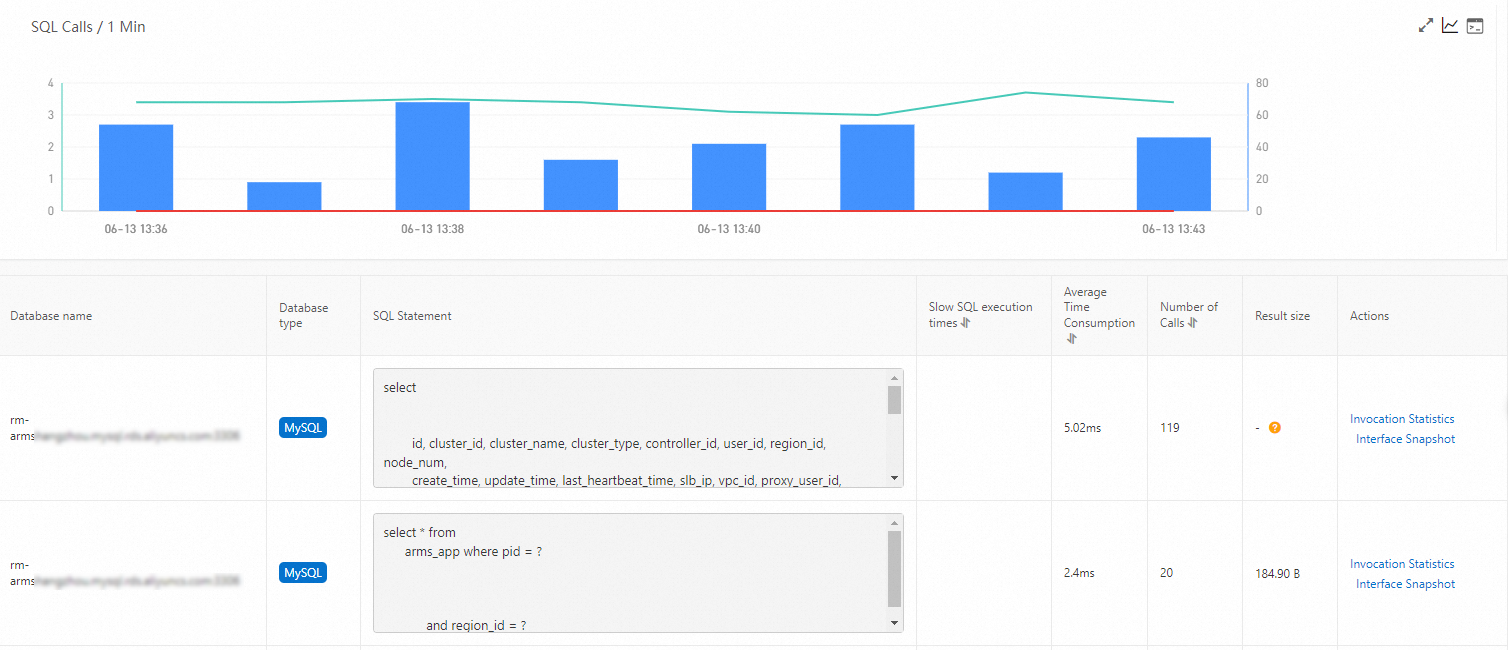
Trace slow queries with SQL and NoSQL analysis
When an API responds slowly, the root cause is often a database query. The SQL Analysis and NoSql Analysis tabs show the SQL and NoSQL statements executed within a selected API, along with execution time.
To identify the slow query causing a performance issue:
Select the slow API from the list in the left-side pane.
On the SQL Analysis or NoSql Analysis tab, review the list of statements sorted by execution time.
Click Interface Snapshot in the Actions column to view the full execution trace for a specific statement. The trace shows exactly where the slow query executes within the overall API call chain.
Analyze exceptions
The Exception Analysis tab lists the Java exceptions thrown from the code of a selected API.
To trace an exception back to its source:
Select the API from the list in the left-side pane.
Review the exceptions listed on the Exception Analysis tab.
Click Interface Snapshot in the Actions column to view the complete trace that includes the exception stack.
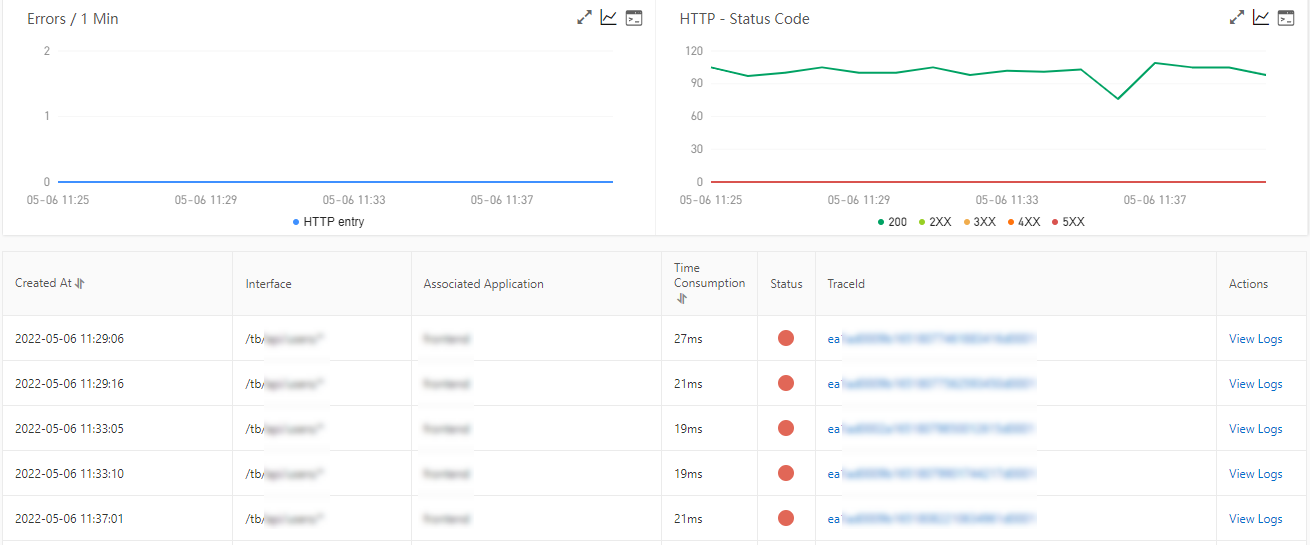
Analyze errors
The Error Analysis tab shows application errors and HTTP status codes.
To investigate an error:
Review the error list on the Error Analysis tab.
Click a value in the TraceId column to view the full trace on a new page.
Examine upstream and downstream dependencies
Use the dependency tabs to understand how your application interacts with other services and to isolate whether a performance issue originates in your application or a dependent service.
Service-level metrics
The Upstream Services and Downstream Services tabs show the APIs and performance metrics of services that call your application (upstream) and services that your application calls (downstream). Metrics include response time, request volume, and error count.
Trace-level details
The Upstream Traces and Downstream Traces tabs provide detailed trace-level views. On these tabs:
Click Expand/Collapse All to show or hide all APIs at once.
Enter an application name or API name keyword in the search box, then click the Search icon to filter results.
Click the collapse panel or the arrow icon at the end of a row to show or hide performance metrics for a specific API.
View API call statistics
The Interface Snapshot tab displays detailed statistics for a selected API through two charts and a parameter details table.
Diagnostic workflow
When you notice a performance issue, use the monitoring tabs together to move from symptom to root cause:
Identify the problematic API. On the Overview tab, sort APIs by response time or error count to find the API that needs attention.
Check for slow database queries. If the API is slow, open the SQL Analysis or NoSql Analysis tab to look for statements with high execution time.
Review exceptions and errors. If the API is failing, check the Exception Analysis tab for Java exceptions or the Error Analysis tab for HTTP errors.
Examine dependencies. If the issue is not in the API code or its database queries, check the Upstream Services and Downstream Services tabs to determine whether a dependent service is the bottleneck.
Trace individual calls. Click a TraceId on any tab to view the full distributed trace and pinpoint the exact operation causing the issue.