When Java applications experience slow responses or outages, the root cause often traces back to JVM-level issues: memory leaks that silently consume heap space, garbage collection pauses that freeze request processing, or thread deadlocks that stall concurrent operations. Enterprise Distributed Application Service (EDAS) continuously monitors JVM metrics for each application instance, including garbage collection (GC) activity, heap and non-heap memory usage, direct buffers, memory-mapped buffers, and thread states. Use these metrics to detect memory leaks, diagnose GC pressure, and resolve thread contention in your microservices.
View JVM metrics
Your application must be deployed in a Kubernetes cluster managed by EDAS.
To open the JVM monitoring dashboard:
Log on to the EDAS console.
In the left-side navigation pane, choose Application Management > Applications.
In the top navigation bar, select a region. In the upper part of the page, select a microservice namespace.
From the Cluster Type drop-down list, select Kubernetes Cluster.
Find the target application and click its name in the Application Name column.
In the left-side navigation pane, choose Monitor > Instance Details.
On the Instance Details page, select a node and click the JVM monitoring tab.
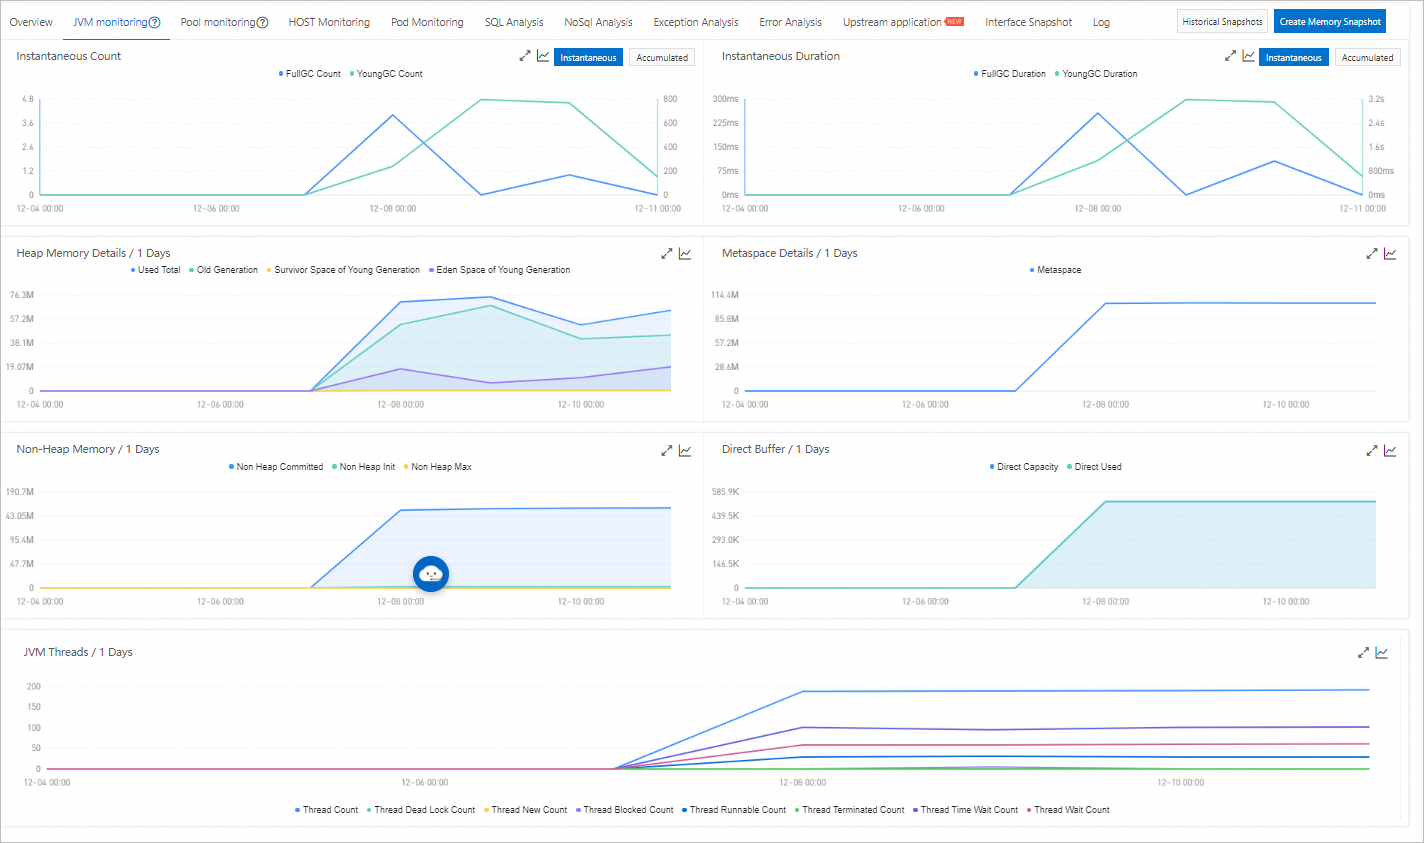
Switch between instantaneous and cumulative views
GC charts support two display modes:
In the GC instantaneous times section, click Instantaneous value or Cumulative value in the upper-right corner to switch between the instantaneous GC count and the accumulated total. The default view shows instantaneous values.
In the GC instantaneous time consumption section, click Instantaneous value or Cumulative value to switch between the instantaneous GC duration and the accumulated total. The default view shows instantaneous values.
Show or hide individual metrics
In any chart, click a metric name in the legend to toggle its visibility.
Each chart must display at least one metric. You cannot hide the last remaining metric.
Metrics reference
The JVM monitoring tab organizes metrics into the following categories.
GC metrics
GC metrics track how frequently the JVM pauses to reclaim unused memory and how long each pause lasts. Frequent or prolonged Full GC pauses often indicate memory pressure or an undersized heap.
| Metric | Type | Description |
|---|---|---|
| FullGC Count | Count | Number of Full GC events (major collections). Full GC reclaims memory across the entire heap and typically causes longer pause times. |
| YoungGC Count | Count | Number of Young GC events (minor collections). Young GC reclaims short-lived objects in the Young Generation and is usually fast. |
| FullGC Duration | Duration | Time spent in Full GC pauses. |
| YoungGC Duration | Duration | Time spent in Young GC pauses. |
Heap memory
Heap memory stores all object instances created by your application. Monitoring heap usage helps you detect memory leaks and right-size your JVM heap.
| Metric | Description |
|---|---|
| Used Total | Total heap memory in use across all memory pools. |
| Old Generation | Memory used by long-lived objects that survived multiple Young GC cycles. A steadily growing Old Generation that never decreases after Full GC may indicate a memory leak. |
| Survivor Space of Young Generation | Memory holding objects that survived at least one Young GC but have not yet been promoted to the Old Generation. |
| Eden Space of Young Generation | Memory where new objects are initially allocated. Most objects are short-lived and reclaimed here during Young GC. |
Non-heap memory
Non-heap memory is used by the JVM for internal structures such as class metadata, compiled code, and thread stacks. Unlike heap memory, non-heap memory is not subject to garbage collection.
| Metric | Description |
|---|---|
| Non Heap Committed | Amount of non-heap memory guaranteed to be available to the JVM. |
| Non Heap Init | Initial non-heap memory allocated at JVM startup. |
| Non Heap Max | Upper limit of non-heap memory the JVM can use. |
Metaspace
Metaspace stores class metadata loaded by the JVM. In Java 8 and later, Metaspace replaces the permanent generation (PermGen) and grows dynamically by default. Rapid Metaspace growth may indicate a classloader leak, commonly seen in applications that perform frequent hot deployments.
Direct buffer
Direct buffers are allocated outside the JVM heap through java.nio.ByteBuffer.allocateDirect(). They are commonly used for I/O-intensive operations because they avoid the overhead of copying data between JVM heap memory and native memory.
| Metric | Description |
|---|---|
| Direct Capacity | Total capacity of all allocated direct buffers. |
| Direct Used | Amount of direct buffer memory currently in use. |
JVM threads
Thread metrics provide visibility into application concurrency. A high number of blocked or deadlocked threads typically points to lock contention or resource bottlenecks.
| Metric | Description |
|---|---|
| Thread Count | Total number of live threads, including both daemon and non-daemon threads. |
| Thread Dead Lock Count | Number of threads in a deadlock state. Any value above zero requires immediate investigation. |
| Thread New Count | Threads that have been created but have not yet started. |
| Thread Blocked Count | Threads blocked waiting to acquire a monitor lock. |
| Thread Runnable Count | Threads currently executing or ready to execute. |
| Thread Terminated Count | Threads that have completed execution. |
| Thread Time Wait Count | Threads waiting for a specified time period (for example, Thread.sleep() or Object.wait(timeout)). |
| Thread Wait Count | Threads waiting indefinitely for another thread to perform an action (for example, Object.wait() without a timeout). |