When applications experience slow responses or unexpected failures, you need visibility into the underlying host resources to determine whether the issue is infrastructure-related. Enterprise Distributed Application Service (EDAS) collects 19 host-level metrics across CPU, memory, disk, load, network traffic, and network packets, so you can identify resource bottlenecks and troubleshoot performance issues without leaving the console.
Monitored metrics
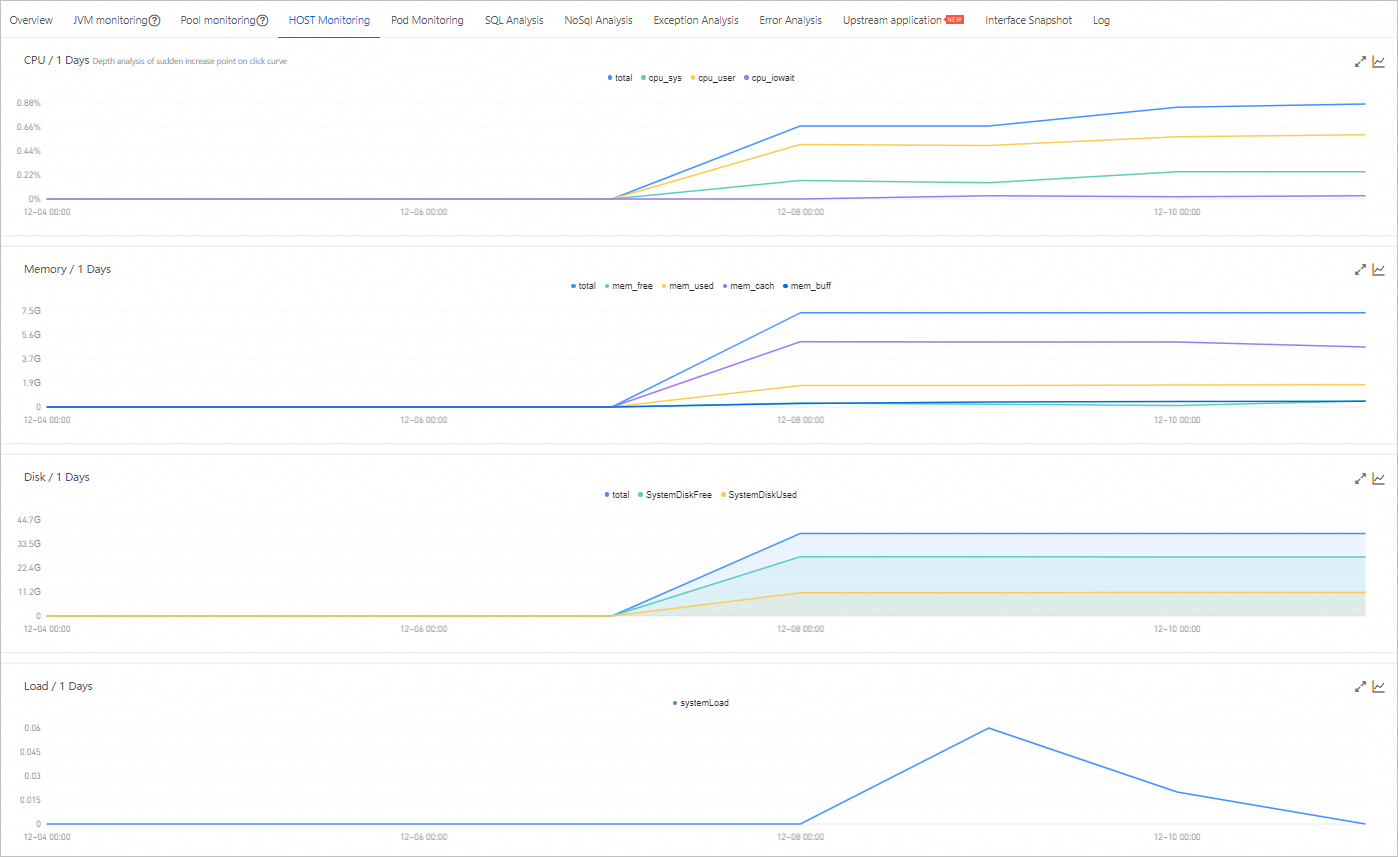
EDAS tracks metrics across six categories. Each metric appears as a time series curve on the HOST Monitoring tab.
CPU
| Metric | Description |
|---|---|
total | Overall CPU utilization across all cores. |
cpu_sys | Percentage of CPU time spent on kernel (system) processes. A sustained high value may indicate excessive system calls or I/O operations. |
cpu_user | Percentage of CPU time spent on user-space processes, including your application code. |
cpu_iowait | Percentage of CPU time waiting for I/O operations to complete. A high value typically points to disk or network bottlenecks. |
Memory
| Metric | Description |
|---|---|
total | Total physical memory on the host. |
mem_used | Memory actively in use by processes. Track this metric to detect memory pressure. |
mem_free | Unused memory not allocated to any process. |
mem_cach | Memory used by the OS page cache to speed up disk reads. This memory is reclaimable and released when applications need it. |
mem_buff | Memory used by kernel buffers for I/O operations. Like page cache, this memory is reclaimable. |
A lowmem_freevalue does not always indicate a problem. Linux aggressively uses available memory formem_cachandmem_buffto improve performance. Evaluatemem_usedalongsidemem_freeto determine actual memory pressure.
Disk
| Metric | Description |
|---|---|
total | Total system disk capacity. |
SystemDiskUsed | Disk space currently in use. |
SystemDiskFree | Available disk space. Monitor this metric to prevent disk-full errors that can cause application crashes or failed log writes. |
Load
| Metric | Description |
|---|---|
systemLoad | System load average. If this value consistently exceeds the number of CPU cores on the host, the host may be overloaded. |
Network traffic
| Metric | Description |
|---|---|
traffic_bytin | Inbound network traffic in bytes. |
traffic_bytout | Outbound network traffic in bytes. |
Network packets
| Metric | Description |
|---|---|
traffic_pktin | Number of inbound packets received. |
traffic_pktout | Number of outbound packets sent. |
traffic_pkterr | Number of error packets. A non-zero value may indicate network interface issues, driver problems, or packet corruption. |
traffic_pktdrp | Number of dropped packets. Drops can result from buffer overflow, congestion, or firewall rules. Investigate if this value increases steadily. |
View host monitoring metrics
Prerequisites
Before you begin, make sure that you have:
An application deployed on a Kubernetes Cluster in EDAS
Access to the EDAS console
Procedure
Log on to the EDAS console.
In the left-side navigation pane, choose Application Management > Applications.
In the top navigation bar, select a region. In the upper part of the page, select a microservice namespace.
From the Cluster Type drop-down list, select Kubernetes Cluster.
Find your application and click its name in the Application Name column.
In the left-side navigation pane of the application details page, choose Monitor > Instance Details.
On the Instance Details page, select the node to inspect and click the HOST Monitoring tab.
Interact with charts
Each metric category (CPU, Memory, Disk, Load, Network Traffic (Bytes), and Network Packets (Count)) appears as a separate time series chart.
Show or hide a metric: Click the metric name (for example, cpu_sys) to toggle its visibility.
Minimum visibility: Each chart requires at least one visible metric. If only one metric is displayed, you cannot hide it.
Troubleshoot common issues
Use the following table to identify and respond to common resource problems:
| Symptom | Likely cause | Recommended action |
|---|---|---|
High cpu_sys with high cpu_iowait | Disk or network I/O bottleneck | Check disk throughput and network latency. Consider upgrading to a higher I/O instance specification. |
Low mem_free with high mem_used | Memory pressure or memory leak | Scale up the instance specification or add more application instances. Review your application for memory leaks. |
Low SystemDiskFree | Disk running out of space | Clean up unnecessary files such as old logs. Expand disk capacity or mount additional storage. |
systemLoad exceeds CPU core count | CPU overload | Add more application instances to distribute the load, or upgrade to an instance type with more CPU cores. |
Increasing traffic_pkterr or traffic_pktdrp | Network interface or configuration issues | Check the network configuration of the host and the associated Kubernetes node. Verify firewall rules and network driver status. |
For application-level performance analysis, use the application monitoring features under Monitor in the EDAS console.