You can use external call monitoring to locate slow calls or errors during the external calls of an application. By surfacing latency, error rates, and HTTP status code trends for every outbound dependency, you can pinpoint which external call is responsible and trace the problem back to the internal API that triggered it.
Typical troubleshooting workflow:
An alert fires for increased response time on your application.
Open external call monitoring and sort by response time to find the slowest external dependency.
On the Overview tab, check request count, error count, and HTTP status code trends.
Switch to the Call source tab to identify which internal APIs triggered the problematic external call.
Access external call monitoring
Log on to the EDAS console.
In the left-side navigation pane, choose Application Management > Applications.
In the top navigation bar, select a region. In the upper part of the page, select a microservice namespace.
From the Cluster Type drop-down list, select Kubernetes Cluster.
Find the target application and click its name in the Application Name column.
In the left-side navigation pane of the application details page, choose Monitor > External Calls.
The left-side pane lists all external calls for the application. Sort by response time, request count, error count, or exception count to prioritize investigation.
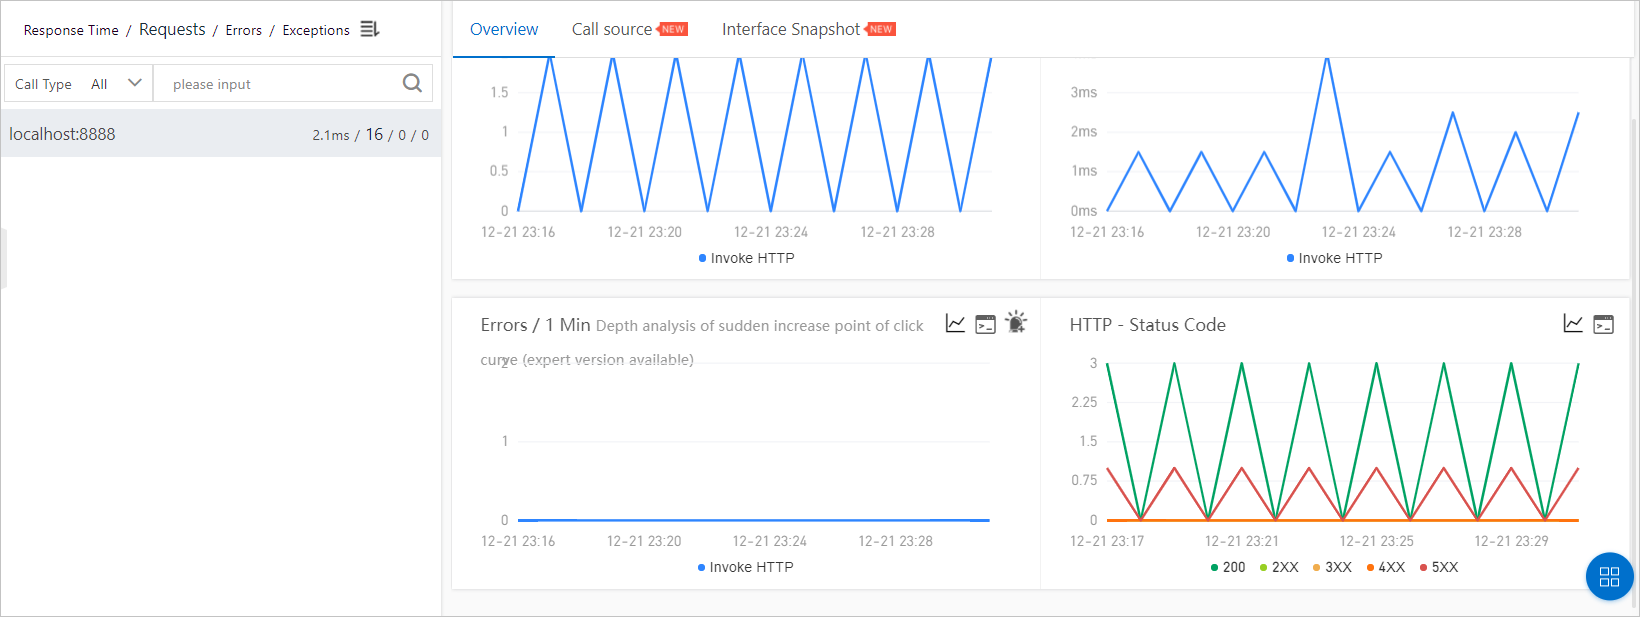
View call overview
Click an external call in the left-side pane to open the Overview tab. This tab displays time-series charts for the following metrics:
| Metric | Description |
|---|---|
| Request count | Total number of requests over time |
| Response time | Latency trends for the selected external call |
| Error count | Failed requests over time |
| HTTP status codes | Breakdown of response status codes |
Trace call sources
Click an external call in the left-side pane, then select the Call source tab. The charts display request count, response time, and error count broken down by the internal APIs that triggered the external call.
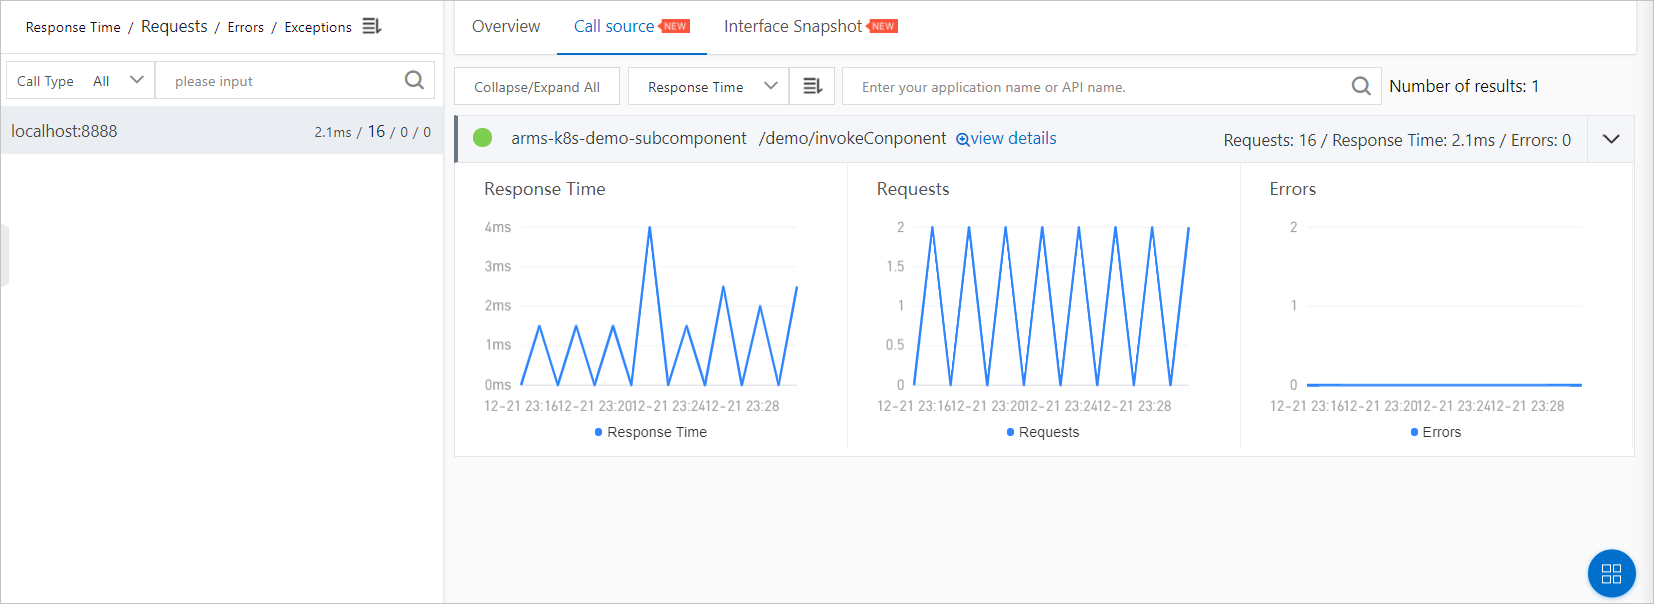
Filter and navigate call sources
| Action | How to |
|---|---|
| Expand or collapse all APIs | Click Collapse/Expand All at the top of the tab. |
| Search for a specific API | Enter an application name or API (span) name in the search box and click the Search icon. |
| Expand or collapse a single API | Click the collapse panel for the API, or click the up or down arrow at the end of the row, to toggle its performance metrics. |
Edition requirements
Enterprise Distributed Application Service (EDAS) provides external call monitoring in Professional Edition and Platinum Edition only. Standard Edition does not support this feature.