You can monitor and check elastic Remote Direct Memory Access (eRDMA) to identify and resolve issues at the earliest opportunity, ensure system security, and efficiently manage and optimize system resources. This topic describes several methods and tools that you can use to monitor and check eRDMA.
Prerequisites
eRDMA is installed and configured on an Elastic Compute Service (ECS) instance. For information about how to configure eRDMA, see Enable eRDMA on an ECS instance.
Use CloudMonitor to monitor eRDMA
You can use Alibaba Cloud CloudMonitor to monitor the working status of eRDMA. You can specify custom CloudMonitor metrics based on your business requirements to process, report, and alert on eRDMA monitoring data. For more information, see Custom monitoring.
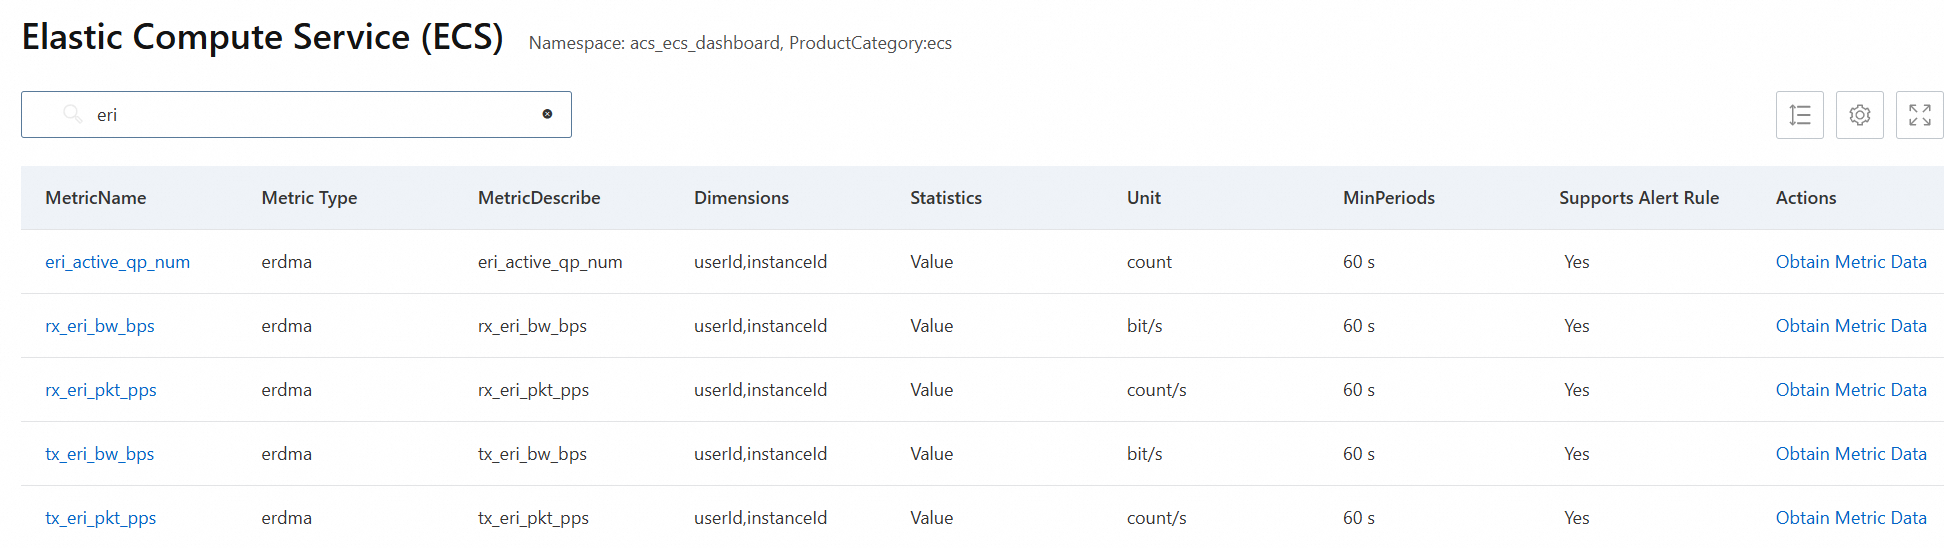
View the CloudMonitor metrics supported by eRDMA
Log on to the CloudMonitor Metric console.
On the Elastic Compute Service (ECS) page, enter eri in the search box above the metric list to search for the CloudMonitor metrics that are supported by eRDMA.
Use eadm to diagnose and troubleshoot issues in eRDMA
eadm is an in-house, user-space management tool that is automatically installed by an eRDMA driver on an ECS instance to provide diagnostic and real-time monitoring capabilities and help identify faults. eadm provides the following features:
Abilities to collect device-wide real-time traffic statistics, including traffic monitoring and assisted diagnostic abilities.
Abilities to perform and query configurations, including the abilities to configure the delay ack feature and congestion control (CC) algorithms.
The following section describes several common eadm commands. For information about other eadm commands, run the eadm -h command to obtain command helps.
eadm is used only for diagnostic and debugging purposes and is subject to changes. eadm is not suitable for all scenarios.
View the help documentation for the
eadmcommandseadm -h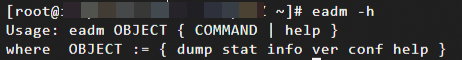
Monitor real-time traffic of an eRDMA device
eRDMA devices whose driver versions are
0.2.34or later support the traffic statistics feature.eadm stat -d <ibdev_name> -l<ibdev_name>specifies the name of the eRDMA device. You can run theibv_devinfocommand to query the names of eRDMA devices. Replace <ibdev_name> with an actual eRDMA device name. If only one eRDMA device is available in your environment, you can omit the-d <ibdev_name>parameter.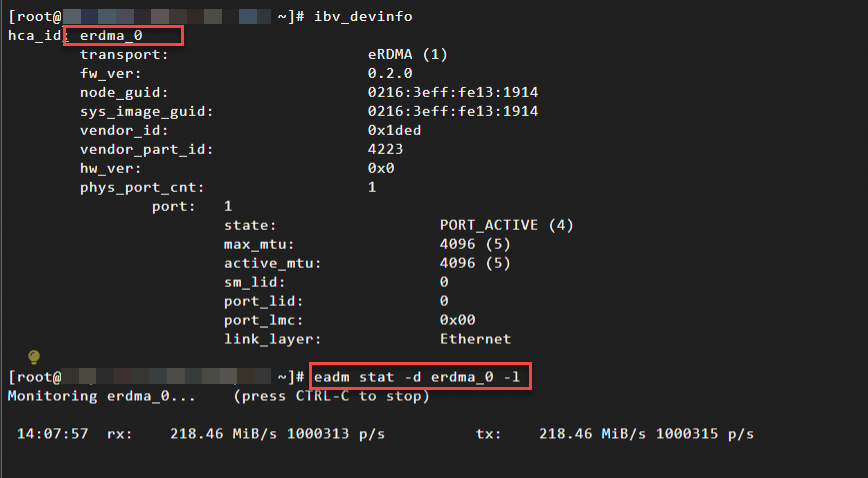
Retrieve statistics about an eRDMA device, such as the number of cm and verebs messages and traffic volumes.
eadm stat -d <ibdev_name><ibdev_name>specifies the name of the eRDMA device. You can run theibv_devinfocommand to query the names of eRDMA devices. Replace <ibdev_name> with an actual eRDMA device name. If only one eRDMA device is available in your environment, you can omit the-d <ibdev_name>parameter.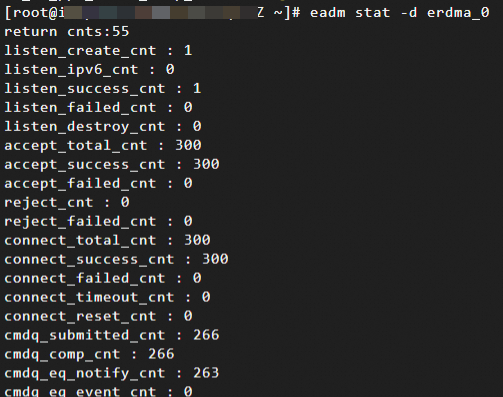
Retrieve the version information of the current eRDMA driver.
eadm ver
Limits apply when you run other eadm commands, such as info, dump, and conf. We recommend that you do not use other eadm commands.
Use Iproute2 to monitor and check eRDMA
Iproute2 is a suite of tools used to configure and manage Linux networks. Iproute2 provides a series of command-line utilities, such as ip and ss, which are used to manage and configure network interfaces, routing tables, and the traffic control feature. This helps network administrators quickly identify and resolve network connectivity issues. Iproute2 also provides rdma commands that can be used to monitor and check RDMA subsystems.
Iproute2 is pre-installed in most Linux distributions, including Alibaba Cloud Linux 3 and Ubuntu 20.00 and later. For more information, see the official documentation of each operating system.
Query the status of eRDMA devices.
rdma link
Query the resource usage of the eRDMA device, such as the number of Completion Queues (CQs), Queue Pairs (QPs), and Memory Regions (MRs).
NoteIn RDMA network communication, Queue Pair (QP), Completion Queue (CQ), Memory Region (MR), and verbs Opcode are the core components. They play important roles in RDMA communication and ensure high efficiency and low latency of RDMA network communication.
For more information, see Basic capabilities and specifications of eRDMA.
rdma res
Query the performance statistics about the eRDMA device, such as the number of connections, connection status, and number of sent and received packets.
rdma -p stat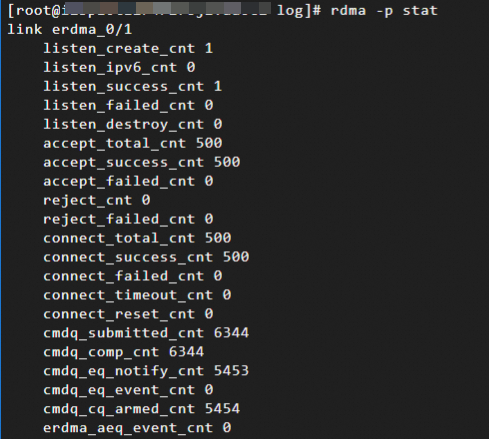
Use the diagnose tool to check RDMA-related issues and evaluate eRDMA performance
You can use the diagnose tool to check the basic functionality of eRDMA, eRDMA high-performance computing (HPC) environments, and the basic latencies of eRDMA. This helps you effectively use eRDMA.
The diagnose tool may return one of the following results for a check item:
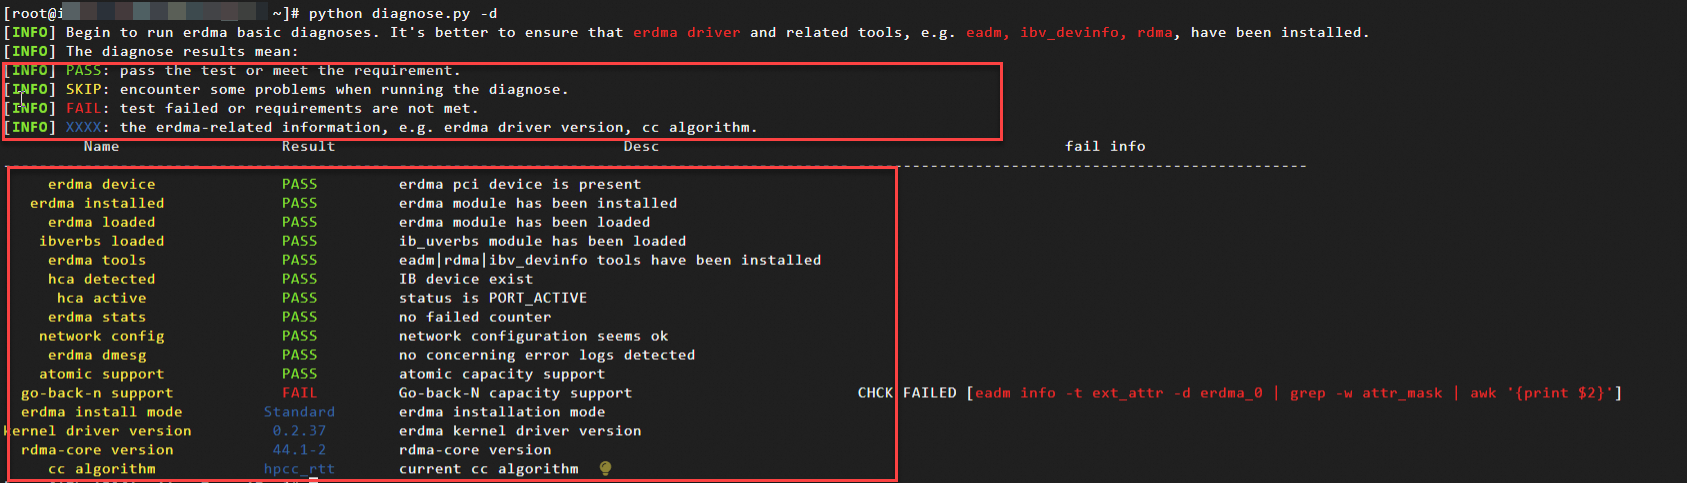
PASS: The check item passed the check.SKIP: The check item does not support the check and is skipped.FAIL: The check tool is not installed or the check item failed the check. You can run the commands that are listed in thefail infosection to check the FAIL items and troubleshoot issues.Other INFO information: indicates eRDMA-related configuration information, such as the installation mode, driver versions, and CC algorithms.
Install the diagnose tool
Run a command on an ECS instance on which eRDMA is configured to obtain the diagnose tool.
Run the following command to obtain the diagnose tool from an internal URL:
wget http://mirrors.cloud.aliyuncs.com/erdma/tools/diagnose.pyRun the following command to obtain the diagnose tool from a public URL:
wget https://mirrors.aliyun.com/erdma/tools/diagnose.py
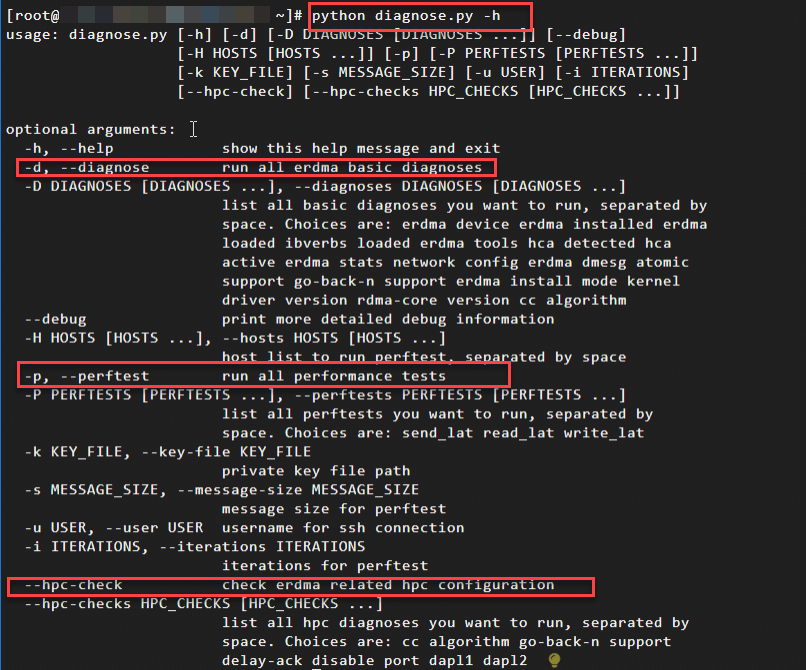
python diagnose.py -h
Check the basic functionality of eRDMA
You can use the diagnose tool to check the basic functionality of eRDMA, including whether eRDMA drivers are installed as expected, whether network connectivity is good, and how the eRDMA kernel-mode driver is installed. This ensures that the basic functionality of eRDMA works as expected and leverages the high throughput and low latency benefits of eRDMA.
Perform the following steps:
Connect to an ECS instance on which eRDMA is configured.
For more information, see Use Workbench to connect to a Linux instance over SSH.
Run one of the following commands to obtain the diagnose tool.
Run the following command to obtain the diagnose tool from an internal URL:
wget http://mirrors.cloud.aliyuncs.com/erdma/tools/diagnose.pyRun the following command to obtain the diagnose tool from a public URL:
wget https://mirrors.aliyun.com/erdma/tools/diagnose.py
Run the following command to check the basic functionality of eRDMA:
python diagnose.py -dThe following command output is returned, which includes the results of check items. For information about the check items, see Check items used in an eRDMA basic functionality check.
Check an eRDMA HPC environment
If you want to run HPC applications in your eRDMA environment, you may require additional dependencies and configurations. You can use the diagnose tool to check the required dependencies for an eRDMA HPC environment.
Perform the following steps:
Connect to an ECS instance on which eRDMA is configured.
For more information, see Use Workbench to connect to a Linux instance over SSH.
Run one of the following commands to obtain the diagnose tool.
Run the following command to obtain the diagnose tool from an internal URL:
wget http://mirrors.cloud.aliyuncs.com/erdma/tools/diagnose.pyRun the following command to obtain the diagnose tool from a public URL:
wget https://mirrors.aliyun.com/erdma/tools/diagnose.py
Run the following command to check the required dependencies for an eRDMA HPC environment:
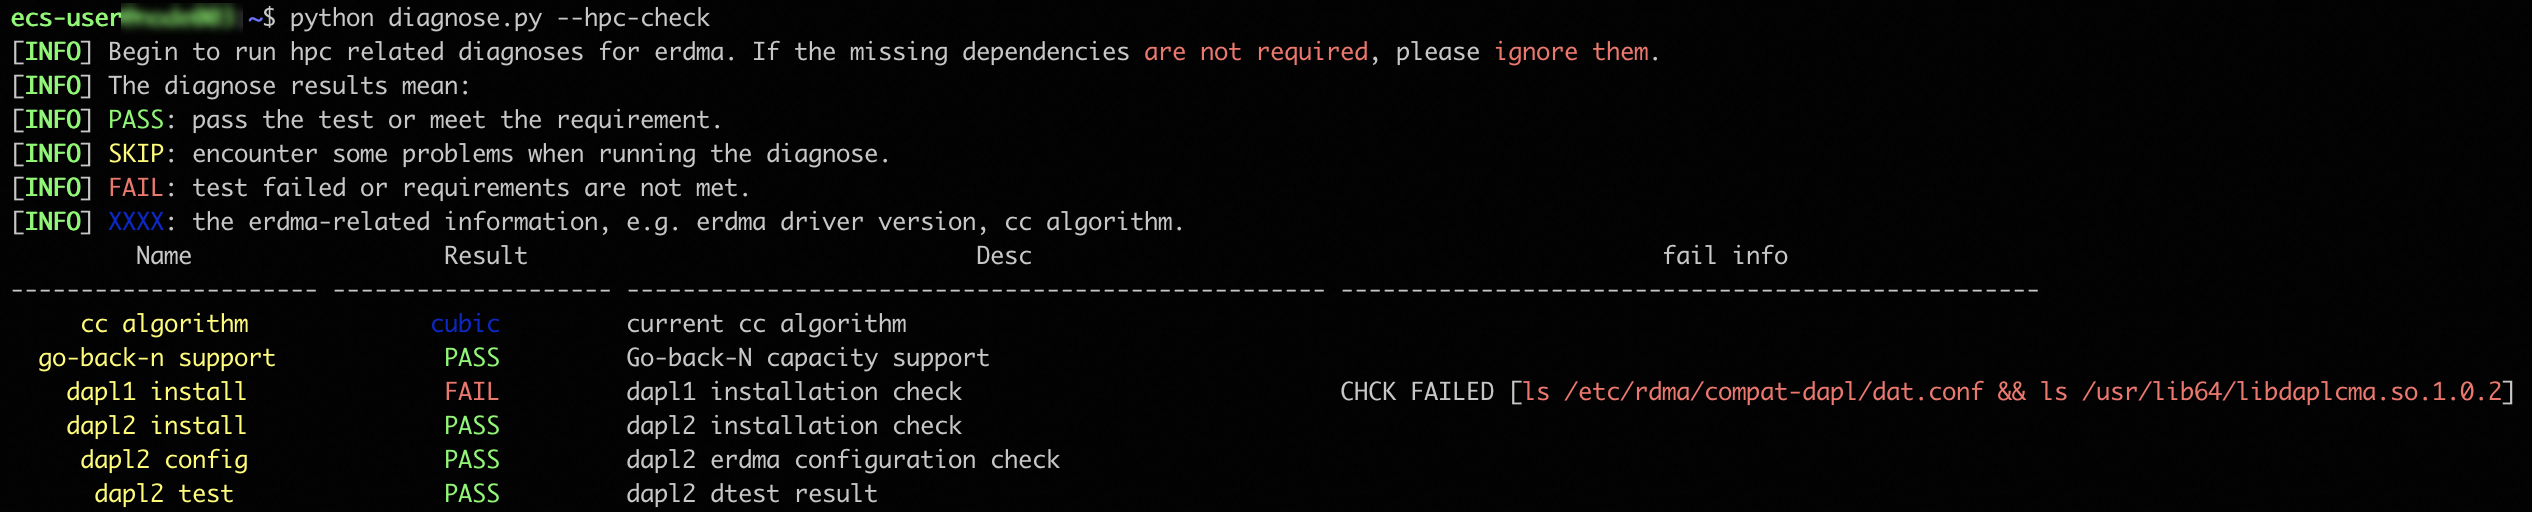
python diagnose.py --hpc-checkIn normal cases, the following command output is returned, which includes the results of check items. For information about the check items, see Check items for dependencies used in an eRDMA HPC environment check.
Test eRDMA network performance
You can use the perftest feature of the diagnose tool to test the eRDMA network performance between ECS instances.
Prerequisites
The following requirements are met:
eRDMA is installed and deployed as expected on all nodes (ECS instances) that you want to test. For information about how to configure eRDMA, see Enable eRDMA on an ECS instance.
Password-free SSH access is allowed between all nodes that you want to test. For more information, see Step 4: Configure password-free SSH logon.
Python paramiko dependencies are installed on all nodes that you want to test.
NoteThe diagnose tool uses paramiko for connections.
To install Python paramiko dependencies, use one of the following sets of commands based on the instance operating system. If you do not have special requirements for the Python version, we recommend that you use Python 3 to reduce configuration workload.
Alibaba Cloud Linux or CentOS
# python3
sudo python3 -m pip install --upgrade pip
sudo python3 -m pip install paramiko
# python2
# If the Python version is Python 2 and python2-pip is not installed, install python2-pip.
sudo yum -y install python2-pip
sudo python2 -m pip install --upgrade pip==20.3.4
sudo python2 -m pip install paramiko
Ubuntu
# python3
sudo python3 -m pip install --upgrade pip
sudo python3 -m pip install paramiko
# python2
# If python2-pip is not installed on the current node, install python2-pip.
sudo apt install software-properties-common
sudo add-apt-repository universe
sudo apt update
sudo apt install python2
sudo curl https://bootstrap.pypa.io/pip/2.7/get-pip.py --output get-pip.py
sudo python2 get-pip.py
sudo python2 -m pip install --upgrade pip==20.3.4
sudo python2 -m pip install paramiko
Procedure
Connect to an ECS instance on which eRDMA is configured.
For more information, see Use Workbench to connect to a Linux instance over SSH.
Run one of the following commands to obtain the diagnose tool.
Run the following command to obtain the diagnose tool from an internal URL:
wget http://mirrors.cloud.aliyuncs.com/erdma/tools/diagnose.pyRun the following command to obtain the diagnose tool from a public URL:
wget https://mirrors.aliyun.com/erdma/tools/diagnose.py
Run the following command to check eRDMA latency:
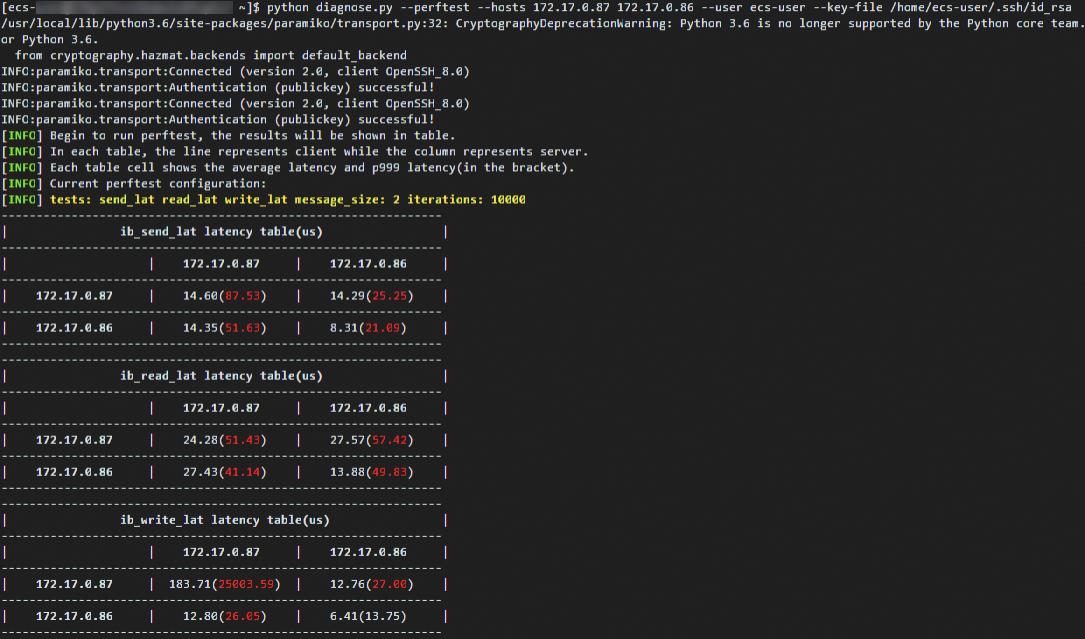
python diagnose.py --perftest --hosts <n1> <n2> --user <username> --key-file </path/to/private_key>Take note of the following parameters:
--hosts <n1> <n2>: specifies the nodes (ECS instances) that you want to check. Separate the nodes with spaces. Replace<n1> <n2>with the private IP addresses of ERIs on the nodes.--user <username>: specifies the username that is used for password-free SSH logon. Replace <username> with an actual username.--key-file </path/to/private_key>: specifies the absolute path of the private key file that is used for password-free SSH logon. Replace </path/to/private_key> with the actual absolute path of a private key file.
The following command output is returned, which indicates the eRDMA latency between two ECS instances. For more information, see Test eRDMA network performance.
Each table in the command output displays the latencies from request initiators to requester responders for an operation. The value in each cell of other columns and rows represents the average latency in microseconds, followed by the 99.9th percentile latency in parentheses.