Liveness probes and readiness probes are mechanisms that are used to check the status of containers. Liveness probes are used to check whether containers run as expected. Readiness probes are used to check whether containers are ready to serve requests. This topic describes how to configure liveness probes and readiness probes to perform health checks on containers. This way, Elastic Container Instance can better monitor and manage the running status of containers and ensure the high availability and stability of services.
Feature description
Elastic Container Instance allows you to use liveness probes and readiness probes to check the condition and running status of containers.
Probe | Description | Scenario |
Liveness probe | Liveness probes are used to check whether a container is working as expected.
|
|
Readiness probe | Readiness probes are used to check whether a container is ready to serve requests.
| An application may be temporarily unable to serve external requests when the application loads a large amount of data or configuration files during startup. In this case, if you do not want to terminate the application or send requests to the application, you can use readiness probes to detect and take action to mitigate such situations. |
Configuration description (API mode)
When you create an elastic container instance by calling the CreateContainerGroup operation, you can use LivenessProbe-related and ReadinessProbe-related parameters to configure liveness probes and readiness probes accordingly. The following table describes the parameters. For more information, see CreateContainerGroup.
LivenessProbe-related parameters
When you configure LivenessProbe-related parameters, you can select only one of the HttpGet, Exec, and TcpSocket check methods.
Parameter | Type | Sample value | Description |
Container.N.LivenessProbe.HttpGet.Path | string | /healthyz | The path to which HTTP GET requests are sent when you use HTTP requests to perform health checks. |
Container.N.LivenessProbe.HttpGet.Port | integer | 8888 | The port to which HTTP GET requests are sent when you use HTTP requests to perform health checks. |
Container.N.LivenessProbe.HttpGet.Scheme | string | HTTP | The protocol type of HTTP GET requests when you use HTTP requests to perform health checks. Valid values:
|
Container.N.LivenessProbe.Exec.Command.N | array | cat /tmp/healthy | Command N to be run in the container when you use the CLI to perform health checks. |
Container.N.LivenessProbe.TcpSocket.Port | integer | 8000 | The port to which Transmission Control Protocol (TCP) socket requests are sent when you use TCP sockets to perform health checks. |
Container.N.LivenessProbe.InitialDelaySeconds | integer | 5 | The number of seconds between the time when the container starts and the time when the check starts. |
Container.N.LivenessProbe.PeriodSeconds | integer | 1 | The interval at which the container is checked. Default value: 10. Minimum value: 1. Unit: seconds. |
Container.N.LivenessProbe.SuccessThreshold | integer | 1 | The minimum number of consecutive successes that must occur before the check is considered as successful. Default value: 1. Set the value to 1. |
Container.N.LivenessProbe.FailureThreshold | integer | 3 | The minimum number of consecutive failures that must occur before the check is considered as failed. Default value: 3. |
Container.N.LivenessProbe.TimeoutSeconds | integer | 1 | The timeout period of the health check. Default value: 1. Minimum value: 1. Unit: seconds. |
ReadinessProbe-related parameters
When you configure ReadinessProbe-related parameters, you can select only one of the HttpGet, Exec, and TcpSocket check methods.
Parameter | Type | Sample value | Description |
Container.N.ReadinessProbe.HttpGet.Path | string | /healthyz | The path to which HTTP GET requests are sent when you use HTTP requests to perform health checks. |
Container.N.ReadinessProbe.HttpGet.Port | integer | 8888 | The port to which HTTP GET requests are sent when you use HTTP requests to perform health checks. |
Container.N.ReadinessProbe.HttpGet.Scheme | string | HTTP | The protocol type of HTTP GET requests when you use HTTP requests to perform health checks. Valid values:
|
Container.N.ReadinessProbe.Exec.Command.N | array | cat /tmp/healthy | Command N to be run in the container when you use the CLI to perform health checks. |
Container.N.ReadinessProbe.TcpSocket.Port | integer | 8000 | The port to which TCP socket requests are sent when you use TCP sockets to perform health checks. |
Container.N.ReadinessProbe.InitialDelaySeconds | integer | 5 | The number of seconds between the time when the container starts and the time when the check starts. |
Container.N.ReadinessProbe.PeriodSeconds | integer | 1 | The interval at which the container is checked. Default value: 10. Minimum value: 1. Unit: seconds. |
Container.N.ReadinessProbe.SuccessThreshold | integer | 1 | The minimum number of consecutive successes that must occur before the check is considered as successful. Default value: 1. Set the value to 1. |
Container.N.ReadinessProbe.FailureThreshold | integer | 3 | The minimum number of consecutive failures that must occur before the check is considered as failed. Default value: 3. |
Container.N.ReadinessProbe.TimeoutSeconds | integer | 1 | The timeout period of the health check. Default value: 1. Minimum value: 1. Unit: seconds. |
Configuration description (console mode)
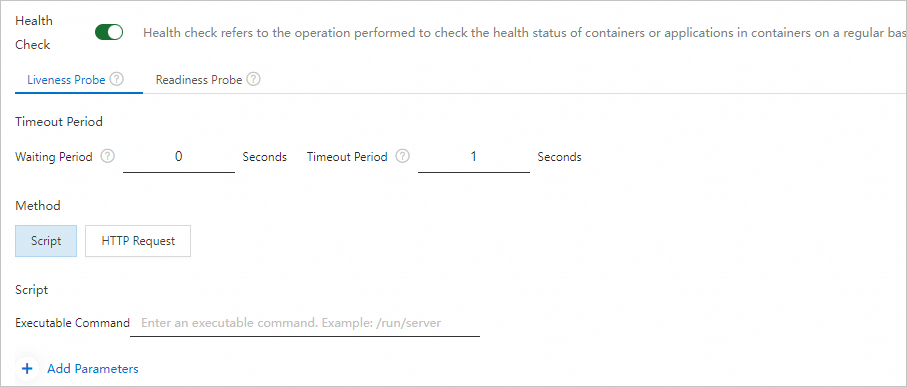
When you create an elastic container instance on the buy page in the Elastic Container Instance console, you can select a container in the Container Configurations section, expand the Advanced Settings of the container, and then turn on Health Check. The following figure shows the configuration details.
When you configure health checks in the Elastic Container Instance console, only the CLI and HTTP request methods are supported. The TCP socket method is not supported.

Parameter | Description |
Timeout Period |
|
Method | Select a check method based on your business requirements. Valid values:
|
Script | If you set Method to Script, you must configure the command line script to be run in the container. |
HTTP Request | When you set Method to HTTP Request, you must configure the path, port, and protocol for HTTP GET requests. |
Configuration examples
In this example, an elastic container instance for which a liveness probe and a readiness probe are configured is created. Then, service exceptions are simulated to check whether the configured probes take effect.
Create an elastic container instance by calling the CreateContainerGroup operation.
The following sample code provides an example on how to use TCP sockets to perform health checks:
ContainerGroupName=test-probe
# Use a NGINX image. Create an elastic IP address (EIP) and associate the EIP with the elastic container instance.
Container.1.Name=container-1
Container.1.Image=nginx
AutoCreateEip=true
# Configure a liveness probe. After the container runs for 5 seconds, the kubelet runs the liveness probe on port 80 every 3 seconds. The timeout period of each check is set to 10 seconds. The minimum number of consecutive successes that must occur before the check is considered as successful is set to 1, and the minimum number of consecutive failures that must occur before the check is considered as failed is set to 3.
Container.1.LivenessProbe.TcpSocket.Port=80
Container.1.ReadinessProbe.InitialDelaySeconds=5
Container.1.LivenessProbe.PeriodSeconds=3
Container.1.LivenessProbe.SuccessThreshold=1
Container.1.LivenessProbe.FailureThreshold=3
Container.N.LivenessProbe.TimeoutSeconds=10
# Configure a readiness probe. After the container runs for 5 seconds, the kubelet runs the readiness probe on port 80 every 3 seconds. The timeout period of each check is set to 10 seconds. The minimum number of consecutive successes that must occur before the check is considered as successful is set to 1, and the minimum number of consecutive failures that must occur before the check is considered as failed is set to 3.
Container.1.ReadinessProbe.TcpSocket.Port=80
Container.1.ReadinessProbe.InitialDelaySeconds=5
Container.1.ReadinessProbe.PeriodSeconds=3
Container.1.ReadinessProbe.SuccessThreshold=1
Container.1.ReadinessProbe.FailureThreshold=3
Container.1.ReadinessProbe.TimeoutSeconds=10
View the related events in the Elastic Container Instance console after an elastic container instance is created.
After an elastic container instance is created, click the ID of the elastic container instance in the Container Group ID/Name column of the instance list page to go to the Instance Details page. Click the Events tab to view the events of the elastic container instance. You can see that the containers on the instance start as expected.

Connect to a container. For more information, see Connect to an elastic container instance.
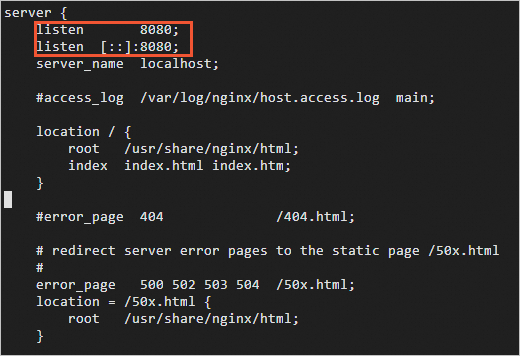
Change the NGINX listening port in the configuration file to simulate a service exception.
Change the NGINX listening port.
NoteIn this example, a NGINX image on which Vim is not installed is used. Before you run the following vi command to change the NGINX listening port, run the
apt-get updateandapt-get install vimcommands to install Vim.vi /etc/nginx/conf.d/default.confFor example, change the NGINX listening port from port 80 to port 8080, as shown in the following figure:

Restart NGINX.
nginx -s reload
View the effective status of the probes.
The container automatically restarts a few seconds after you restart NGINX. View the events of the elastic container instance. You can see that the container was restarted after the liveness probe and the readiness probe each have check failures.
