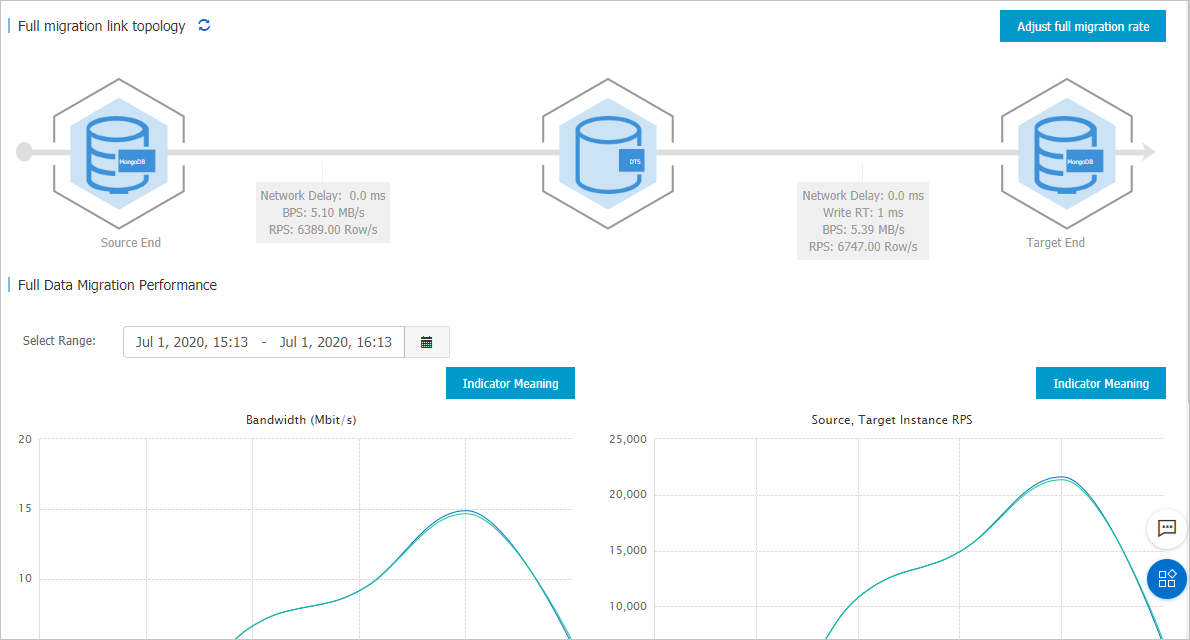
This topic describes how to view the connection state and performance of full data migration in the Data Transmission Service (DTS) console. DTS provides the following connection and performance metrics: bytes per second (BPS), records per second (RPS), read/write response time, and network latency. You can monitor and manage data migration tasks by using these metrics.
Procedure
- Log on to the DTS console. Note If you are redirected to the Data Management (DMS) console, you can click the
 icon in the lower-right corner to go to the previous version of the DTS console.
 - In the left-side navigation pane, click Data Migration.
- At the top of the Migration Tasks page, select the region where the data migration instance resides.
- On the Migration Tasks page, click the ID of the data migration instance.
- In the left-side navigation pane, choose .
- On the page that appears, the connection state and performance of full data migration are displayed. You can select a time range to view the trend charts of performance metrics for full data migration.

Section Description Topology of Full Data Migration In this section, you can view the read/write performance and network information about the connections between DTS and the source and destination databases. The following parameters are provided: - Connection between DTS and the source database
- BPS: the amount of data that DTS reads from the source database per second. Unit: MB/s.
- RPS: the number of records that DTS reads from the source database per second.
- Network Latency: the network latency between DTS and the source database.
- Connection between DTS and the destination database
- BPS: the amount of data that DTS writes to the destination database per second. Unit: MB/s.
- RPS: the number of records that DTS writes to the destination database per second.
- Network Latency: the network latency between DTS and the destination database.
- Write RT: the response time period when DTS writes data to the destination database.
Performance of Full Data Migration In this section, you can view the bandwidth, RPS, read/write response time, and network latency. Note To view the description of performance metrics, move the pointer over the Indicator Meaning button at the upper-right corner of a trend chart. - Connection between DTS and the source database