In the Data Transmission Service (DTS) console, you can view the performance of full data synchronization and incremental data synchronization. DTS provides the connection and performance metrics to help you manage data synchronization tasks.
Procedure
- Log on to the DTS console. Note If you are redirected to the Data Management (DMS) console, you can click the
 icon in the lower-right corner to go to the previous version of the DTS console.
 In the left-side navigation pane, click Data Synchronization.
At the top of the Synchronization Tasks page, select the region where the data synchronization instance resides.
On the Synchronization Tasks page, click the ID of the data synchronization instance.
Perform one of the following operations:
View the connection status and performance of full data synchronization
In the left-side navigation pane, choose .
On the page that appears, the connection status and performance of full data synchronization are displayed. You can select a time range to view the trend charts of performance metrics for full data synchronization.

Section
Description
Topology of Full Data Synchronization
In this section, you can view the read/write performance and network information about the connections between DTS and the source and destination databases. The following parameters are provided:
Connection between DTS and the source database
BPS: the amount of data that DTS reads from the source database per second. Unit: MB/s.
RPS: the number of records that DTS reads from the source database per second.
Network Latency: the network latency between DTS and the source database.
Connection between DTS and the destination database
BPS: the amount of data that DTS writes to the destination database per second. Unit: MB/s.
RPS: the number of records that DTS writes to the destination database per second.
Network Latency: the network latency between DTS and the destination database.
Performance of Full Data Synchronization
In this section, you can view the bandwidth, records per second (RPS), read/write response time, and network latency.
NoteTo view the description of performance metrics, move the pointer over the Indicator Meaning button at the upper-right corner of a trend chart.
View the connection status and performance of incremental data synchronization
In the left-side navigation pane, choose .
On the page that appears, the connection status and performance of incremental data synchronization are displayed. You can select a time range to view the trend charts of performance metrics for incremental data synchronization.

Section
Description
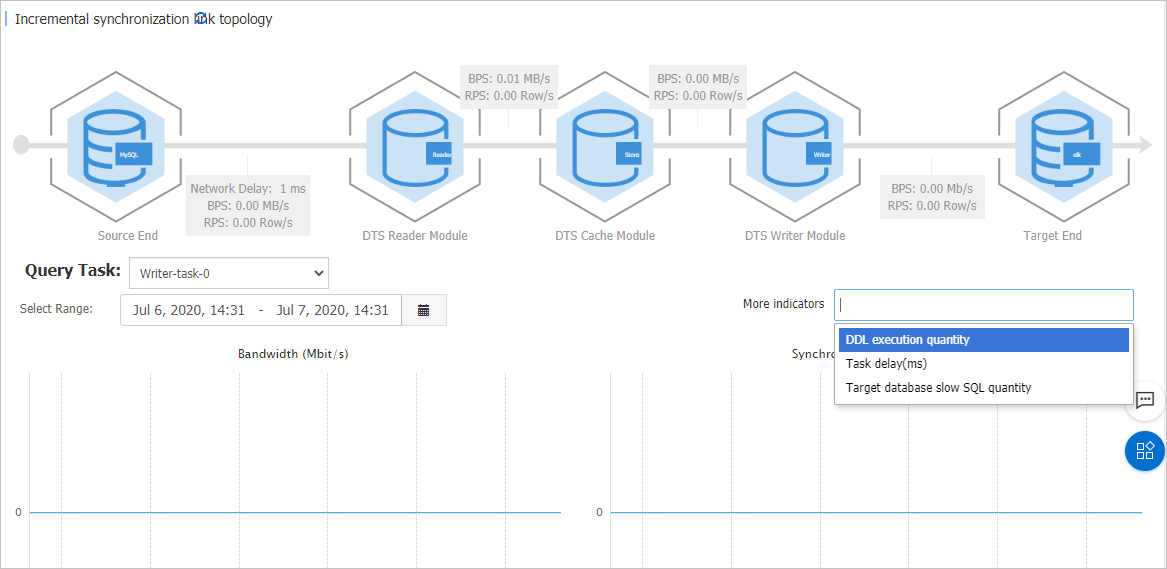
Topology of Incremental Data Synchronization
In this section, you can view the data transmission status and network latency between DTS modules and the source and destination databases. DTS modules include the data collection module, the data cache module, and the data writing module. The following parameters are provided:
BPS: the bandwidth between DTS modules. Unit: MB/s.
RPS: the number of records that are transmitted between DTS modules per second.
Network Latency: the network latency between DTS modules and the source and destination databases.
Performance of Incremental Data Synchronization
In this section, you can view performance information such as the bandwidth, synchronization speed, and synchronization latency. You can select metrics from the More Metrics drop-down list.
The following metrics are provided:
Bandwidth (MB/s): the bandwidth of data that the data writing module pulls from the data pulling module per second.
Synchronization Speed (TPS): the number of transactions that DTS synchronizes to the destination database per second.
Synchronization Latency: the difference between the timestamp of the latest synchronized data in the destination database and the current timestamp in the source database. Unit: milliseconds.
Number of DDL Operations: the number of data definition language (DDL) operations that are executed in the destination database within the selected time range.
Latency (ms): the difference between the time when a data record is generated in the source database and the time when the data record is written to the destination database. For example, if a data record is generated in the source database at 7 o'clock and DTS writes the data record to the destination database at 8 o'clock, the task is delayed by 1 hour.
Slow SQL Queries: the number of slow SQL queries that are generated in the destination database within the selected time range.