When a Data Transmission Service (DTS) instance experiences latency that exceeds 600 seconds due to specific reasons, the DTS Insight, the intelligent O&M assistant of DTS, automatically diagnoses the DTS instance and generates latency messages. This topic describes how to view this latency.
Prerequisites
An instance may be in a latency state due to instance class throttling, hotspot tables, cross-region transmission performance, or destination database write performance. DTS Insight has generated latency messages.
For more information, see What is DTS Insight?.
Usage notes
For errors that DTS Insight cannot repair, you must manually address them or contact technical support for troubleshooting at the earliest opportunity.
The solutions generated by DTS Insight in conjunction with the Tongyi Qianwen model are for reference only. You must independently evaluate the feasibility of these solutions.
Procedure
In this example, a data synchronization instance is used to show how to view the latency returned by DTS Insight.
Use one of the following methods to go to the Data Synchronization page and select the region in which the data synchronization instance resides.
DTS console
Log on to the DTS console.
In the left-side navigation pane, click Data Synchronization.
In the upper-left corner of the page, select the region in which the data synchronization instance resides.
DMS console
NoteThe actual operations may vary based on the mode and layout of the DMS console. For more information, see Simple mode and Customize the layout and style of the DMS console.
Log on to the DMS console.
In the top navigation bar, move the pointer over Data + AI and choose .
From the drop-down list to the right of Data Synchronization Tasks, select the region in which the data synchronization instance resides.
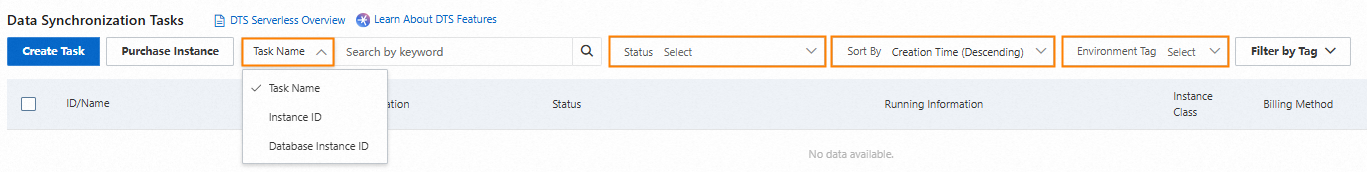
Find the instance that you want to manage.
You can filter the instance by Task Name, Instance ID, or Database Instance ID.
View the latency messages in one of the following two ways.
View in the task list
In the Running Information column of the instance, click View delay reasons.
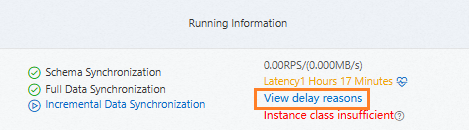
In the dialog box that appears, view the returned messages.
View in the error module
Click the ID of the instance.
On the Task Management page, click the Incremental Write module.
Optional: Click the Basic Information tab in the error module.
View the latency.