DataWorks provides various charts to show statistics on each API. You can view the monitoring charts to obtain information about a specific API, such as API gateway status codes, DataService Studio error codes, the number of requests from applications, traffic and bandwidth, and average response time.
Go to the Statistics Details page
Log on to the DataWorks console. In the top navigation bar, select the desired region. In the left-side navigation pane, choose . On the page that appears, select the desired workspace from the drop-down list and click Go to DataService Studio.
In the top navigation bar of the page that appears, click the Service Management tab. The Manage APIs page appears.
In the left-side navigation pane, choose . The Statistics Details page appears.
Find the desired API and click Monitoring Chart in the Actions column.
View the monitoring charts
HTTPS Status Codes
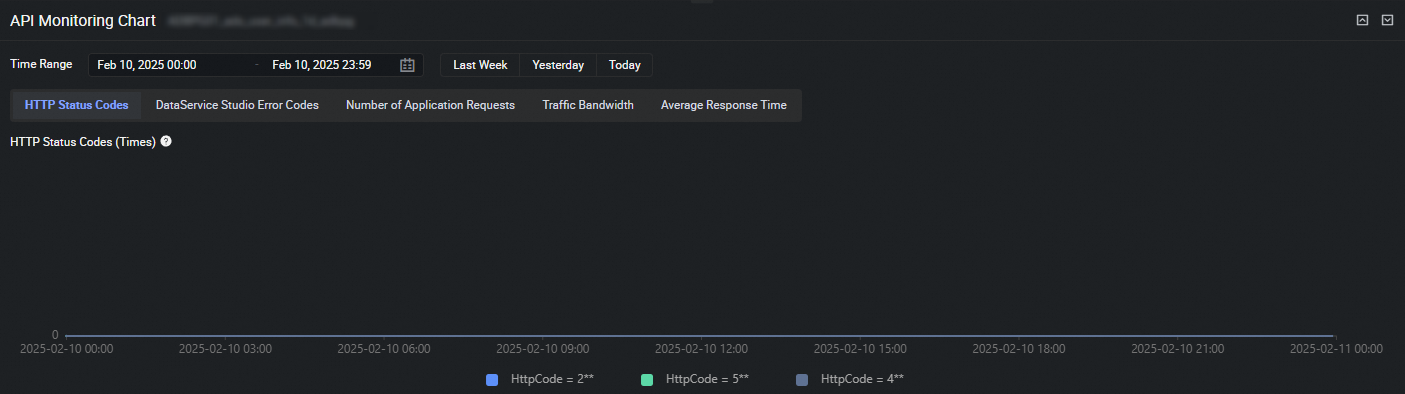 This metric shows the change trends in the numbers of different types of HTTP status codes that are returned by the API in a specific period of time.
 DataService Studio Error Codes
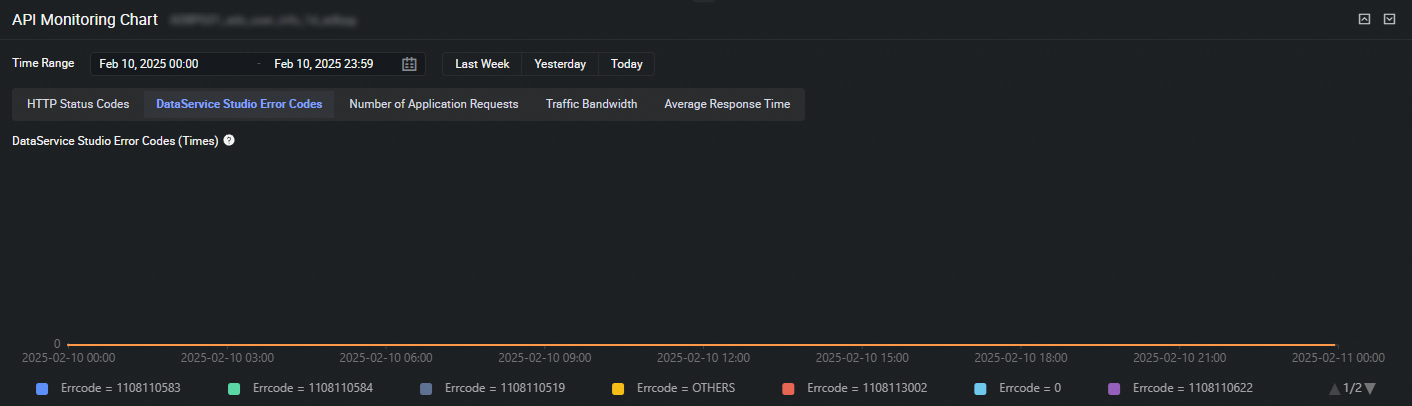 This metric shows the change trends in the numbers of different types of DataService Studio error codes that are returned by the API in a specific period of time. This helps you efficiently identify and troubleshoot issues. For more information about DataService Studio error codes, see Appendix: DataService Studio error codes.
 Number of Application Requests
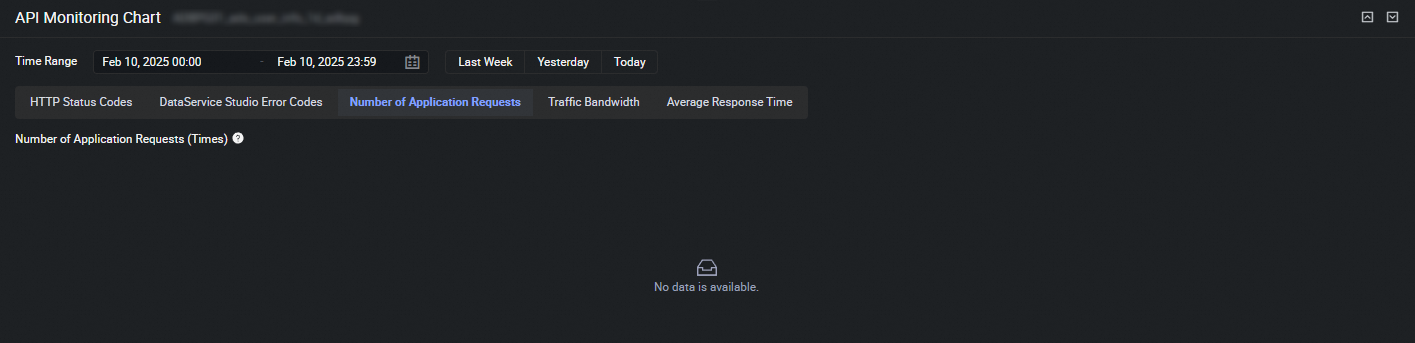 This metric shows the change trends in the number of times that the API is called by each application.
 Traffic Bandwidth
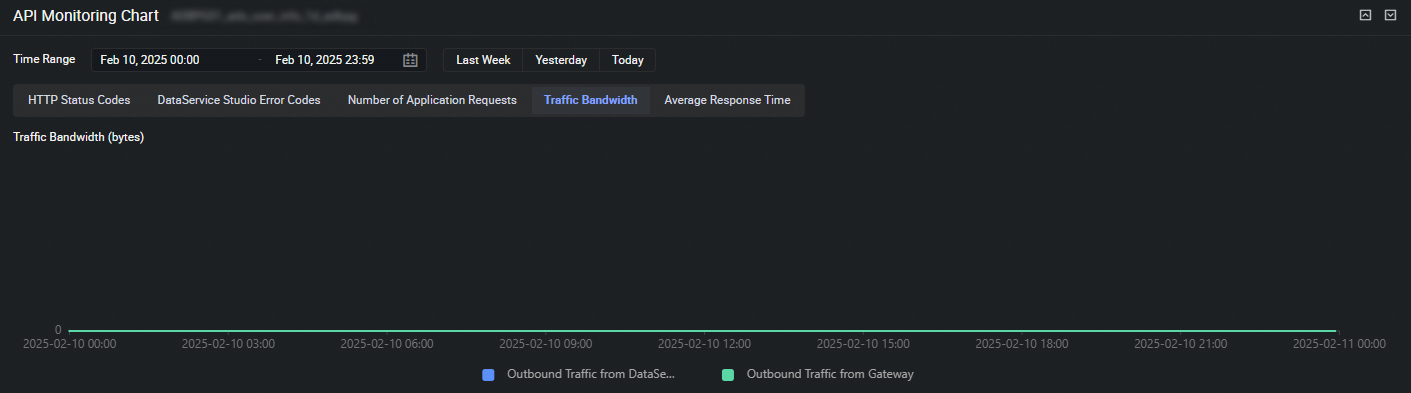 This metric shows the change trends in the outbound traffic from DataService Studio and the outbound traffic from API Gateway in a specific period of time after the API is called.
 Response Time
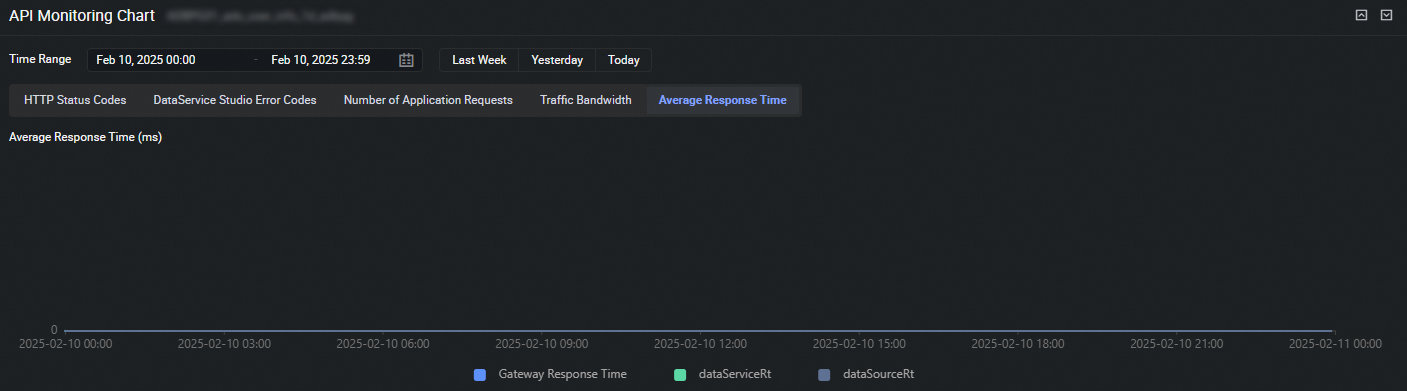 This metric shows the change trends in the response time of API Gateway, DataService Studio, and the specific data source after the API is called.
 The overall response time of APIs in DataService Studio depends on the response time in API Gateway. The response time in API Gateway covers the response time in DataService Studio, and the response time in DataService Studio covers the response time of data sources.