A one-time instance is generated after a one-time task runs. You can use a list or a Directed Acyclic Graph (DAG) to view instance details and perform operations.
You can configure monitoring alerts only for the running status of recurring instances. Monitoring alerts are not supported for one-time instances, data backfill instances, or test instances.
You must purchase DataWorks Professional Edition or a later version to use the intelligent diagnosis feature for one-time instances.
Go to the one-time instance page
Log on to the DataWorks console. In the top navigation bar, select the desired region. In the left-side navigation pane, choose . On the page that appears, select the desired workspace from the drop-down list and click Go to Operation Center.
In the navigation pane on the left, click to go to the one-time instance page.
Manage instances
You can view and manage one-time instances, trigger-based workflow instances, and manually triggered workflow instances.
Manage one-time instances
After you run a one-time task, a one-time instance is generated on this page. For more information, see Manage one-time tasks.
Go to the Manual Triggered Instances tab. You can filter and view information about one-time instances by criteria such as Task Name, Task Type, and Data Timestamp.
Manage one-time instances.
Single operation: In the Actions column for an instance, you can Stop or Rerun the one-time instance. You can also click More to view the instance log and other information.
Batch operations: Select multiple one-time instances and click the Stop or Rerun button at the bottom of the page to perform batch operations.
DAG operations: Perform operations in the DAG. For more information, see Manage the DAG of a one-time instance.
Manage triggered workflow instance
After a workflow is run manually or by an event trigger, a corresponding workflow instance is generated on this page. For more information, see Manage trigger-based workflows.
Go to the Triggered Workflow Instance tab. You can filter and view information about trigger-based workflow instances by criteria such as Task Name, Trigger, and Data Timestamp.
NoteManually triggered run: For a manually triggered workflow instance, the Trigger column displays
-.Event-triggered run: For an event-triggered workflow instance, the trigger name is displayed in the Trigger column.
Manage trigger-based workflow instances.
Single operation: In the Actions column for an instance, you can Stop or Rerun the trigger-based workflow instance. You can also click to edit the node in Data Studio.
Batch operations: Select multiple trigger-based workflow instances and click the Stop, Batch Rerun, Set To Successful, Change Priority, Modify Resource Group, or Refresh Instance button at the bottom of the page to perform batch operations.
DAG operations: Perform operations in the DAG. For more information, see Manage the DAG of a one-time instance.
The icons below the task instance name provide an overview of the instance's running status.
 : The number of running instances.
 : The number of successful instances.
 : The number of failed instances.
 : The number of instances in other states.
Manage instance in manually triggered workflow
After you run a manually triggered workflow, a manually triggered workflow instance is generated on this page. For more information, see Manage manually triggered workflows.
Go to the Instance in Manually Triggered Workflow tab. You can filter and view information about manually triggered workflow instances by criteria such as Workflow, Status, and Business Time.
Manage manually triggered workflow instances.
Single operation: In the Operations column for an instance, you can Stop or Rerun the manually triggered workflow instance.
Batch operations: Select multiple manually triggered workflow instances and click the Stop, Rerun, Set To Succeeded, Modify Priority, Modify Resource Group, or Refresh Instance button at the bottom of the page to perform batch operations.
DAG operations: Perform operations in the DAG. For more information, see Manage the DAG of a one-time instance.
The icons below the manually triggered workflow name provide an overview of the workflow instance's running status.
 : The number of running instances.
 : The number of successful instances.
 : The number of failed instances.
 : The number of instances in other states.
Manage the DAG of a one-time instance
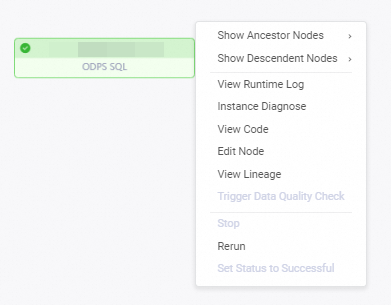
Click the instance name or DAG in the Actions column to open the DAG for that instance. In the DAG, you can right-click an instance to perform operations.
In the list of manually triggered workflows, click a workflow name to display its DAG on the right. The DAG may contain multiple tasks.
Operation | Description |
Show Ancestor Nodes | Expands six levels of ancestor nodes for the node. Note You can expand ancestor nodes only for manually triggered workflow instances. |
Show Descendent Nodes | Expands six levels of descendant nodes for the node. Note You can expand child nodes only for manually triggered workflow instances. |
View Runtime Log | View the run log for the current instance, which shows statuses such as running, succeeded, and failed. Note
|
Instance Diagnose | DataWorks Operation Center provides an intelligent diagnosis feature to help you understand the end-to-end information of a task run and quickly locate issues. For more information, see Intelligent diagnosis. |
View Code | View the code of the current node. |
Edit Node | Click to go to the Data Studio page to modify the content of the current workflow. |
View Lineage | View the data lineage of the current instance. |
Stop | Stops the task from running. This operation is valid only for the current instance. |
Rerun | Reruns a specified task. This is often used to handle failed nodes and missed nodes. Note You can only rerun tasks that are in the succeeded or failed state. |