If a node in a baseline or an ancestor node of the node fails to run, or a node on the key path slows down, an error or slowdown event is generated. You can view the information about the event on the Events tab.
Background information
DataWorks can identify an exception that prevents a node in a smart baseline from being completed on time and send you an alert notification about the exception at the earliest opportunity. This ensures that important data is generated within the expected time frame in scenarios in which dependencies between nodes in a baseline are complex.
Limits
Only DataWorks Standard Edition and more advanced editions support the event management feature. If you use DataWorks Basic Edition, you must upgrade it to DataWorks Standard Edition or a more advanced edition before you can use the event management feature. For more information, see Differences among DataWorks editions.
Terms
Error: indicates that a node fails to run.
Slow: indicates that the running time of a node is significantly longer than the average running time of the node in the previous periods.
If a node slows down and then encounters an error, two events are generated.
View events

Section | Description |
Filter conditions | In the rectangle marked with 1 in the preceding figure, you can specify filter conditions to search for events. You can filter events by setting the Owner, Detection Time Range, Event Status, Event Type, Priority, Node, and Node Instance parameters. In the search results, each event is displayed in a row and associated with a node that encounters an error or slowdown. |
Events | In the rectangle marked with 2 in the preceding figure, you can view the information about each event in the Event ID, Status, Workspace, Node Instance, Priority, Type, Time, and Worst Baseline columns. You can also click View Details, Handle, and Ignore in the Actions column that corresponds to an event to perform related operations.
|
View event details
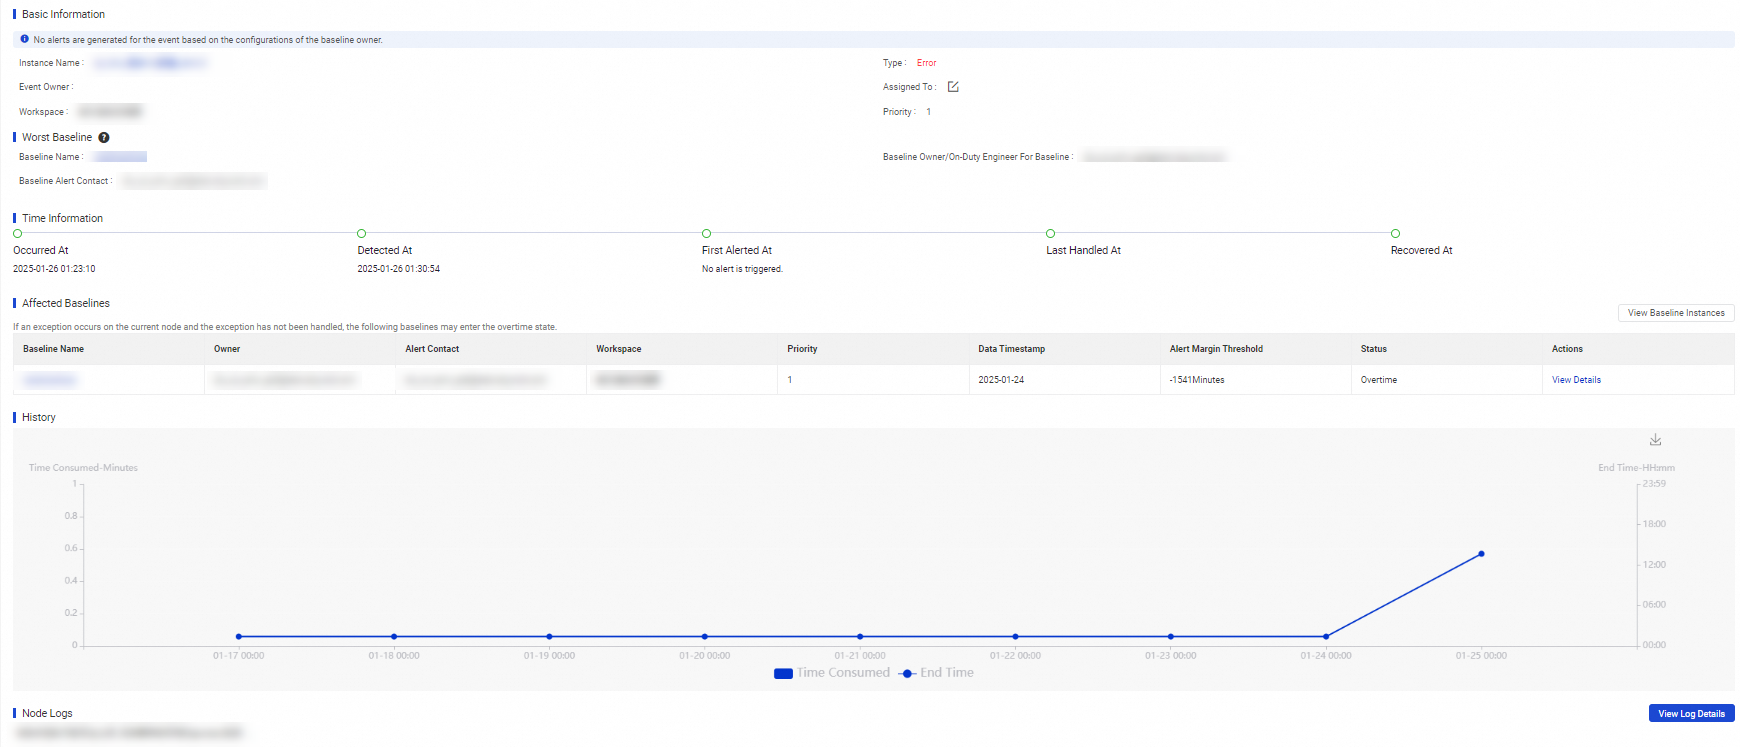
Click View Details in the Actions column that corresponds to an event. On the page that appears, you can view the time when the event occurred, the time when the first alert notification about the event was sent, the time when the event was cleared, the historical operation logs of the node associated with the event, and the detailed node logs. 
Basic Information: This section displays the basic information about the event, such as the name of the node associated with the event, event type, and event owner.
Worst Baseline: If the node associated with the event has multiple descendant nodes in baselines that are enabled, the baseline with the least alert margin is considered as the worst baseline and displayed in this section.
Time Information: This section displays the points in time related to the event along a timeline. You can view the time when the event occurred, the time when the event was detected, the time when the first alert notification about the event was sent, the latest time when the event was handled, and the time when the event was cleared. You can click View Alert Content to go to the alert details page of the event.
Affected Baselines: This section displays the baselines whose data output is affected by the event.
History: This section displays the trend chart of the daily data output time of the node associated with the event.
Node Logs: This section displays the operation logs generated for the auto triggered instance of the node associated with the event on the current day.