This topic provides a concise introduction to the DataV-Board console modules, enabling you to quickly familiarize yourself with the interface layout.
Visualization workspace
Workspace
The workspace serves as the primary gateway for creating data dashboards. Here, you can engage in activities such as data preparation, widget development, resource management, and the creation and viewing of data dashboards.
Ordinal number | Area name | Description |
1 | Menu bar | The menu bar primarily encompasses the workspace, design center, visualization academy, help and tutorials, access to the visualization application center, account management, user center, theme switch, and more. |
2 | Workspace | This area is dedicated to workspace management within the visualization workspace, including the management of space groups and space quotas. For more information, see the workspace overview. |
3 | Project group | This section displays the project group in the visualization workspace, offering functionalities such as adding, deleting, modifying, and searching project groups, along with accessing the recycle bin. For more information, see project group management. |
4 | Feature navigation | This area centrally showcases featured functions in the visualization workspace, including dataset/data source/filter management, widget package development, block design and management, favorites management, and centralized design resource management.
|
5 | Create dashboard | This area is dedicated to dashboard creation within the visualization workspace, supporting the creation of PC dashboards. |
6 | Data dashboard | This area manages data dashboards within the visualization workspace, including previewing, publishing, editing, copying, transferring, shifting to project groups, renaming, and deleting. For more information, see manage data dashboards. |
Visualization application center
The Visualization application center enables you to customize the sequence of data dashboard presentations and supports screen casting on both web and client platforms.
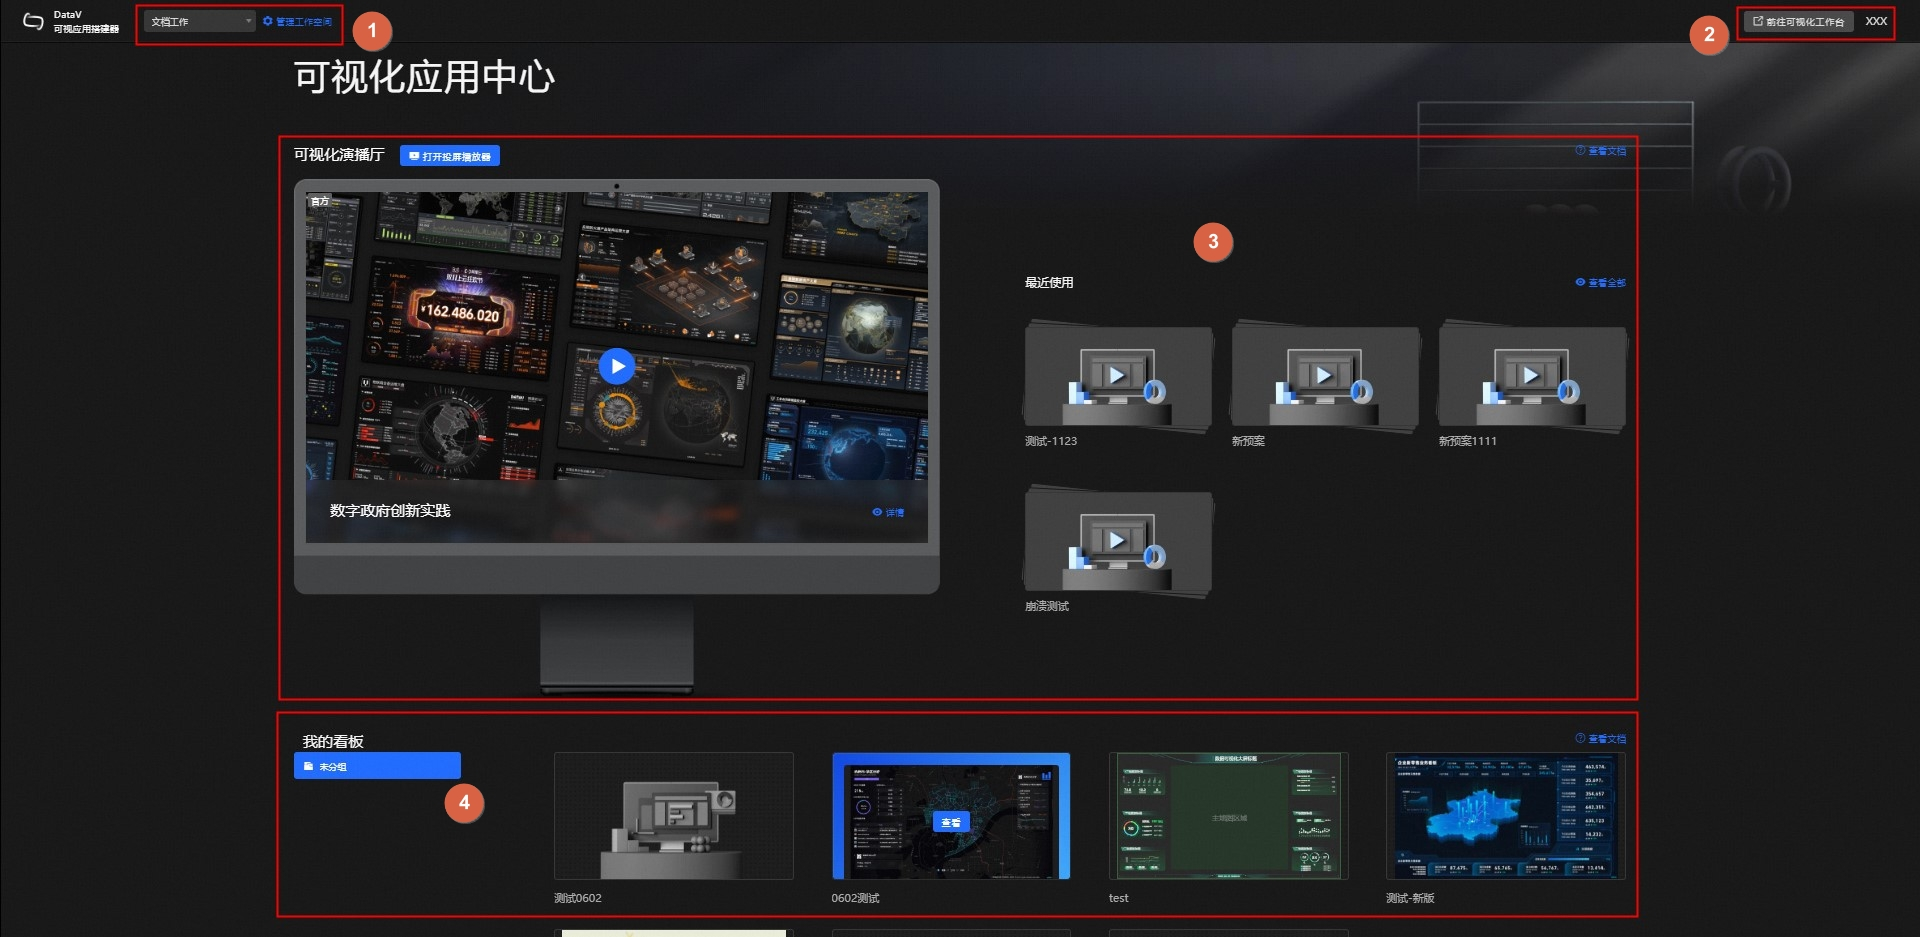
Ordinal number | Area name | Description |
1 | Workspace | This area manages workspaces within the visualization application center. Switching workspaces allows quick access to various visualization centers and viewing options. Click to manage workspaces and navigate to the workspace management page. For more information, see the workspace overview. |
2 | Menu bar | This area features the menu bar in the visualization application center, including options to navigate to the visualization workspace and view account details. |
3 | Plan display | This section displays demonstration plans within the visualization application center, including screen casting demonstrations and a comprehensive view of all functionalities. |
4 | My dashboard | This area showcases data dashboards within the visualization application center. Once a data dashboard is published in the visualization workspace, it appears here for display. |
Visualization studio
Within the visualization application center, click on the right side to view recent uses and enter the visualization studio. Here, you can create demonstration plans and manage them efficiently.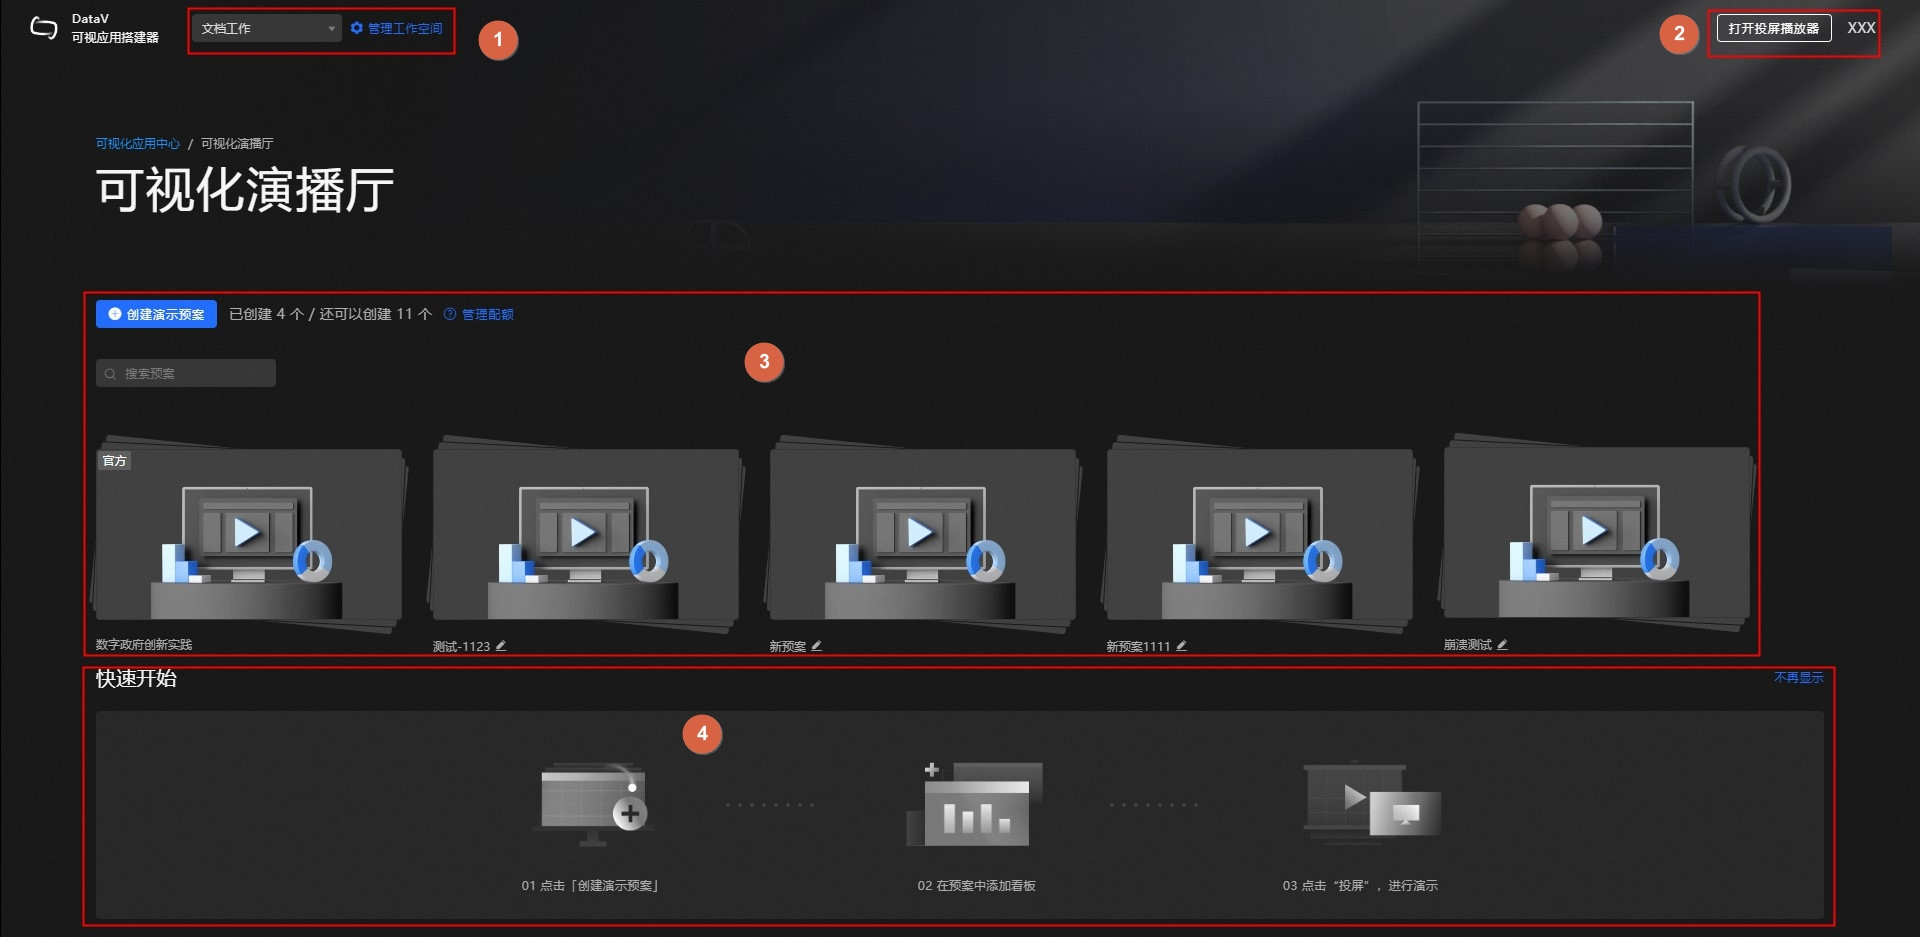
Ordinal number | Area name | Description |
1 | Workspace | This area is for workspace management within the visualization studio. Switching workspaces allows for quick access to different visualization centers and viewing options. Click to manage workspaces and proceed to the workspace management page. For more information, see the workspace overview. |
2 | Menu bar | This section features the menu bar in the visualization studio, including options for opening the screen casting player and viewing account details. |
3 | Manage plans | This area is for managing demonstration plans within the visualization studio, including creating, screen casting, previewing, editing, deleting plans, and managing quotas. For more information, see manage plans. |
4 | Quick start | This section provides new user tutorials within the visualization studio, offering a quick start guide to the demonstration plan feature. For more information, see screen casting plans. |
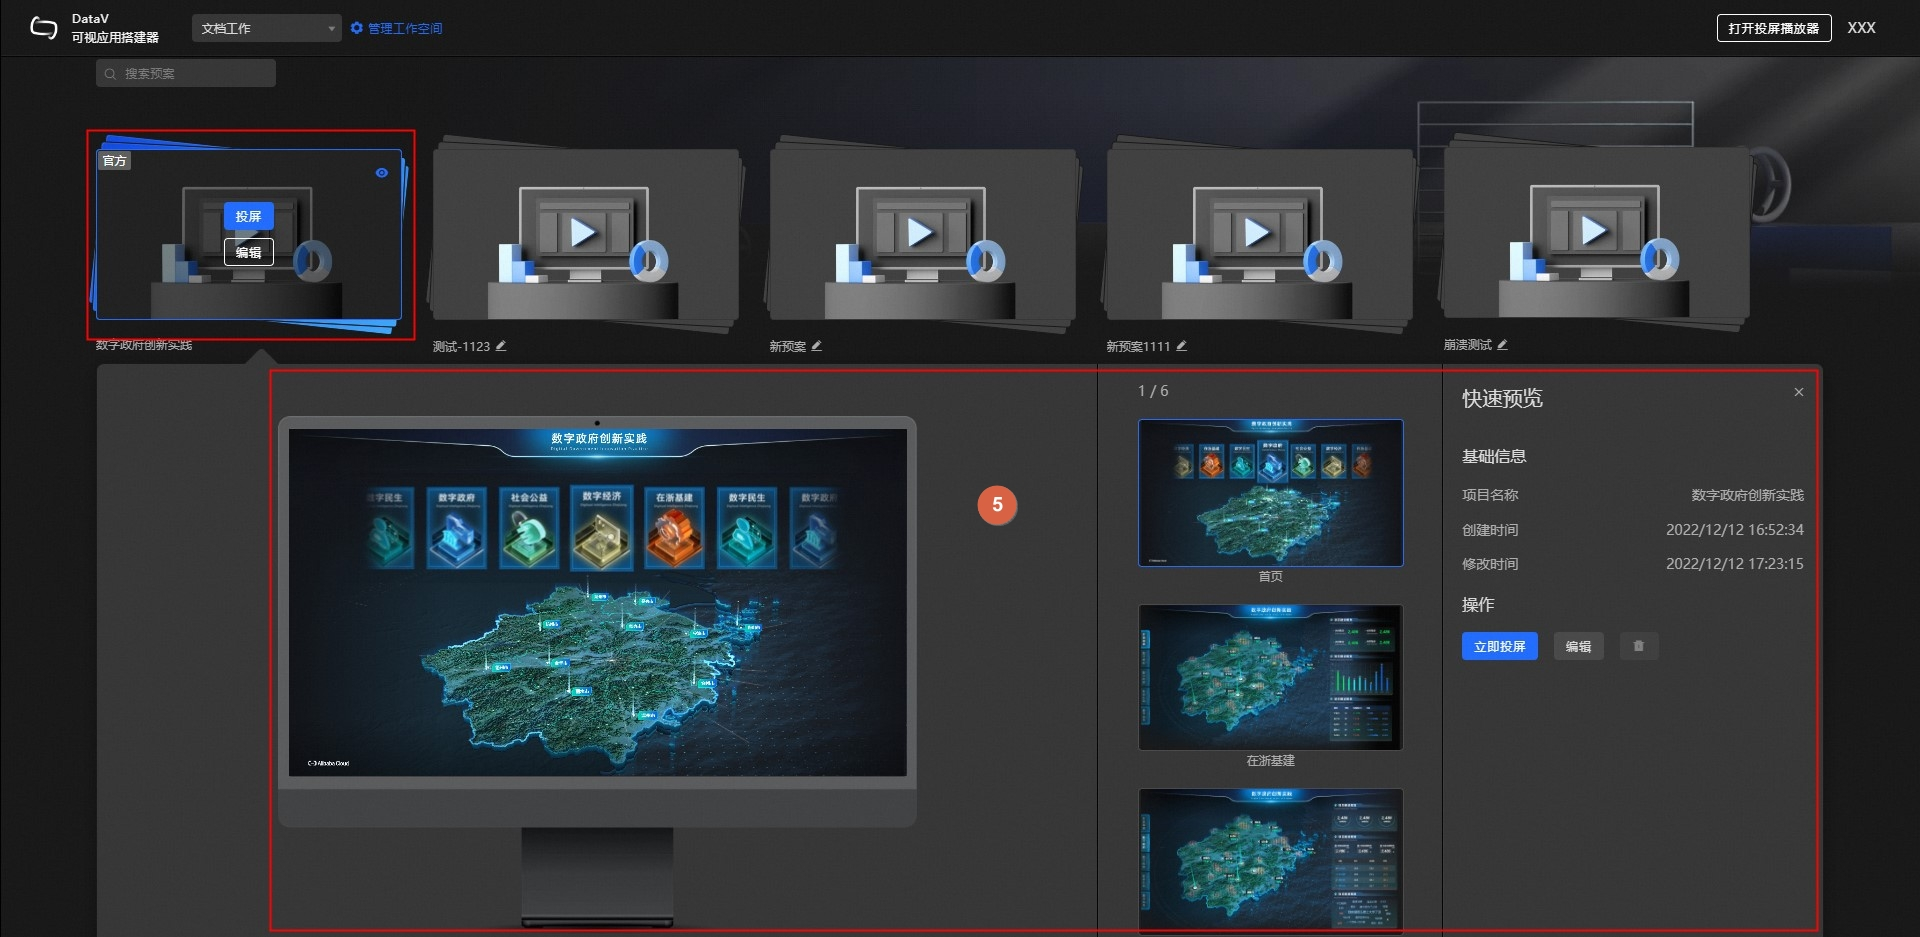
5 | Quick preview | This area is for quick previews of demonstration plans in the visualization studio, allowing you to view basic information, screen cast, edit, and delete plans. |