This topic describes the features of the Debugging Preview page in DataV.
DataV supports two preview modes: Normal Preview and Debugging Preview.
Normal Preview: In the upper-right corner of the editor, click the Preview icon (
 ). If you select Normal Preview, DataV does not record errors and logs when you preview a visualization application.
 Debug Preview: In the upper-right corner of the editor, click the Preview icon (
) and select Debug Preview. DataV records the interaction logs and error messages in the components and blueprints when you preview the visualization application.
The Debugging Preview feature is available only when you view projects on a PC. It cannot be used if you view projects on a mobile terminal.
By default, logging and error reporting are enabled for debugging preview.
Blueprint Logs and Errors
Prerequisite: You have right-clicked the line you want to listen to and selected Enable Logging in Blueprint Editor. 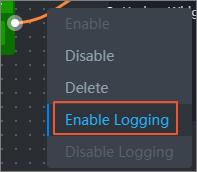 When an interaction is generated on the Debug Preview page, if the interaction is logged, the relationship between the upstream and downstream nodes of the connection and the data snapshot generated when the interaction is triggered are recorded.
After you open the Debugging Preview page, you can click Enable Debugging on the left of the page, click the Blueprint Logs and Errors tab, and perform the following operations:
Start Logging /Pause Logging: Click the
 icon to switch to Start Logging to listen to Blueprint logs and report errors or Pause Logging to disable logging. Note
To minimize the impact of log updates on DataV performance, we recommend that you disable automatic data updates or increase the interval for automatic data updates when you use Debugging Preview.
Clear Logs: You can click the Clear Logs icon to delete all logs or errors.
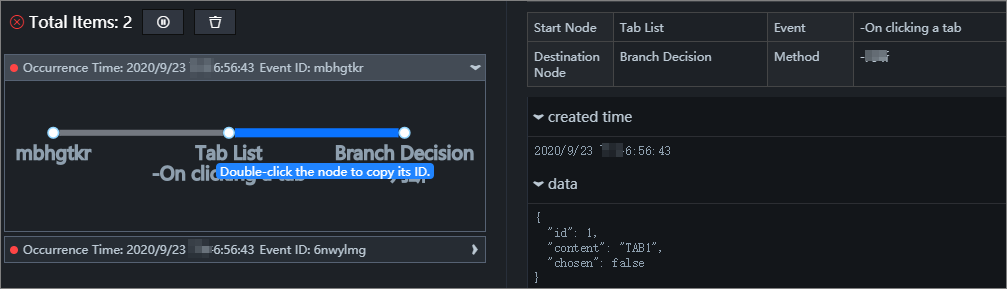
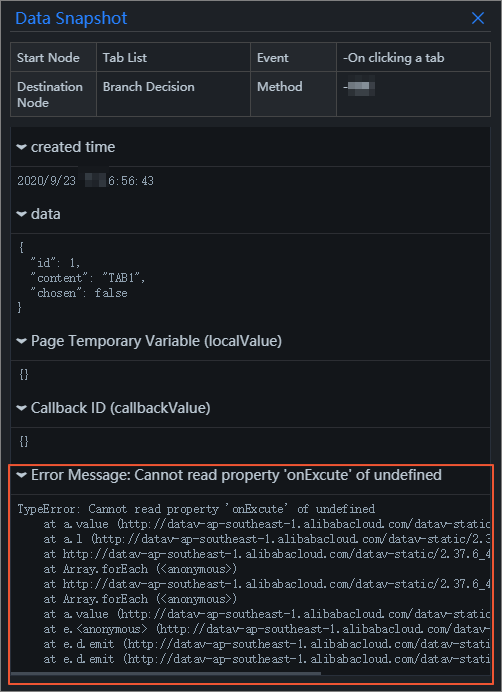
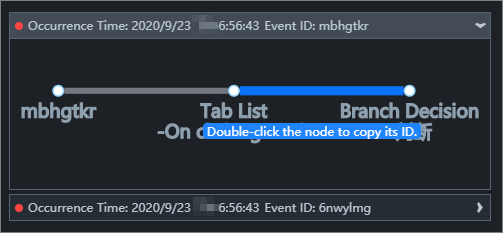
Log record: A record is added to the top of the record list each time an interaction occurs. Click a log entry and select the line in the log entry. The Data Snapshot dialog box appears on the right. The dialog box describes the data, callback ID (if any), temporary page variables (if any), and error stack.
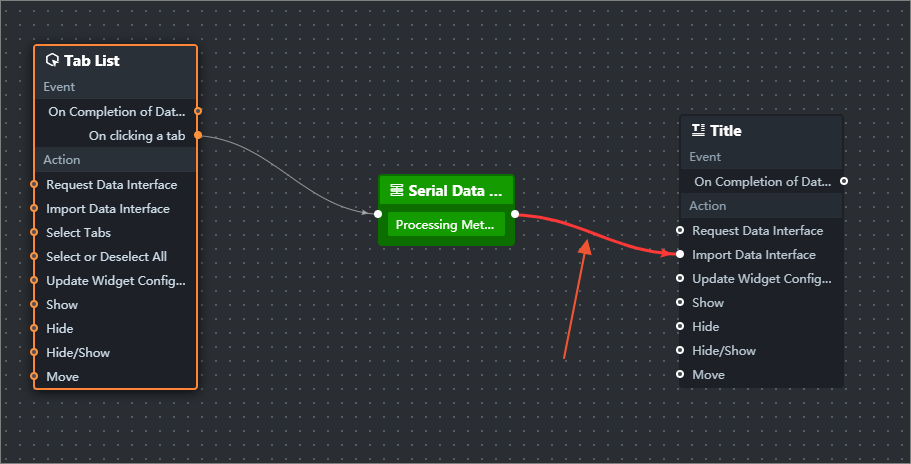
If an error is reported during the recording of the interaction log, the line connection is displayed in red. Click the red line to display the error stack in the Data Snapshot section.
If no error is reported during the recording of the interaction log, the line connection is displayed in blue.
NoteIn the logical node on the left side of the line, if the getLocalValue and getCallbackValue are used and the callback ID and temporary variable are obtained, they will be recorded in the data snapshot of localValue and callbackValue.
Copy Node ID: Double-click a node in the record to copy the node ID. You can search for and locate the copied ID in Blueprint Editor.
Widget Logs and Errors
After you open the Debugging Preview page, you can click Enable Debugging on the left of the page, click the Widget Logs and Errors tab, and perform the following operations:
Start Recording /Pause Recording: Click the
icon to switch to the Start Recording mode to listen to component logs and errors or the Pause Recording mode to disable the monitoring. NoteTo minimize the impact of log updates on DataV performance, we recommend that you disable automatic data updates or increase the interval for automatic data updates when you use Debugging Preview.
Clear Logs: You can click the Clear Logs icon to delete all logs or errors.
Log record: Each time an error occurs during a widget request, a record of this error is added to the top of the records. Click to select an error record. In the Data Snapshot dialog box that appears, the data, callback ID (if any), temporary page variables (if any), and error stack are displayed.
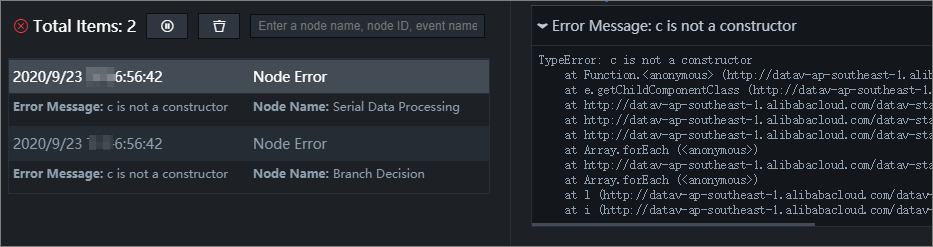
Table 1. Common error types for component log entry Error Type
Description
Data source error
This type of error occurs when a widget requests a data source. The request for the data source may occur when the component is first loaded, when the component is automatically updated, when the component callback ID triggers an update, or when the blueprint triggers an action to request the data source. The error information includes the widget ID, data source ID, and error description.
Filter errors
This type of error occurs when data returned for a data source request passes through a filter. The error information includes the widget ID, data source ID, filter ID, and error description.
Component internal errors
This type of error occurs when a widget is rendered or a widget method is executed. The error information includes the widget ID and widget method.
Node internal errors
This type of error occurs when the code for a node in Blueprint Editor encounters an error during node initialization.
NoteA warning is generated when a widget method is called because a parameter does not conform to the widget declaration.
Copy widget ID: Double-click the widget name in the error message to copy the widget ID to the clipboard.
Search widget ID: the name of the widget to which you want to copy the widget. Paste it in the search box in the editor to quickly find the widget and modify the widget configuration as prompted.
Filter widget error logs: Enter a widget name, widget ID, filter ID, or error information in the input box to view all the errors associated with the entered information.
Debugging tips
Logs are recorded at the smallest granularity. If the interaction effect of the target component is not generated, you can start from the action of the target component and check whether the incoming data at each step is correct.