This topic describes log fields and how to view the access logs of Cloud Parallel File Storage (CPFS) for Lingjun.
Log fields
Field | Description |
Arglno | The inode of the request. |
ClientArriveTime | The time when the request was received. |
ClientGid | The group ID (GID) of the Linux user. |
ClientHostName | The hostname of the client. |
ClientLocalMount | The local mount path of the file system. |
ClientUid | The unique ID (UID) of the Linux user. |
DestFilePath | The new path of the file, which can be specified by the rename or link operation. |
FilePath | The full path name. |
MicroTime | The time when the request was sent. Unit: microseconds. |
Operation | The type of the operation. Valid values: open, create, link, remove, rename, readdir, setattr, read, write, readlink, and mount. |
RequestId | The request ID. |
Filelno | The inode of the file path. |
Second | The time when the request was sent. Unit: seconds. |
SourceIp | The IP address and port of the physical server or container. |
Status | The status of the response. |
Vers | The protocol version. |
Volume | The ID of the file system. |
Query example
This section describes how to query the file systems that are mounted within a specific period of time.
Log on to the Simple Log Service console.
In the Projects section, click the project you want.

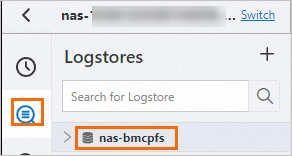
In the left-side bar, click the Log Storage icon. In the Logstores list, find the nas-bmcpfs Logstore and click its name.
Enter a query statement and set a time range within which you want to query the log data.
In this example, the query statement is operation:mount and the time range is set to Current Week to query the file systems that are mounted within this week. For more information about the fields that can be queried, see the Log fields section of this topic.

View query results. |
Histograms
When you move the pointer over a green rectangle, you can view the corresponding period of time and the number of returned logs within the period of time.
If you double-click a green rectangle, you can view log distribution at a fine-grained level. You can also view the returned logs within the specified period of time on the Raw Logs tab.
Raw logs
The Raw Logs tab displays the log query and analysis results. For more information about the log fields, see the Log fields section of this topic.