This topic describes how to use PyTorch Profiler to identify the performance bottlenecks of a PyTorch model, use NVIDIA TensorRT to optimize the model, and then use Triton Inference Server to deploy the optimized model. In this topic, a PyTorch ResNet-50 model is used.
Background information
NVIDIA TensorRT is an SDK that is used to accelerate model inference for deep learning tasks. NVIDIA TensorRT includes deep learning inference optimizers and runtimes that reduce inference latencies and improve the throughput. Triton Inference Server is an open source model inference framework provided by NVIDIA. Triton Inference Server supports mainstream machine learning frameworks, such as PyTorch, TensorFlow, NVIDIA TensorRT, and ONNX.
Typically, deep learning models are evaluated and optimized after the models are trained. This allows you to reduce the inference latency and throughput before you release the model. These optimizations reduce the amount of GPU memory required by the model and enable GPU sharing to improve GPU utilization.
In this topic, a PyTorch ResNet-50 model is trained to recognize the following figure dog.jpg. PyTorch Profiler is used to identify the performance bottlenecks of the PyTorch ResNet-50 model. NVIDIA TensorRT is used to optimize the model. Triton Inference Server is used to deploy the optimized model. 
Prerequisites
A Container Service for Kubernetes (ACK) cluster that contains GPU-accelerated nodes is created. For more information, see Use GPU scheduling in ACK clusters.
Nodes in the cluster can access the Internet. For more information, see Enable an existing ACK cluster to access the Internet.
The Arena component is installed. For more information, see Install Arena.
Persistent volume claims (PVCs) are created in the cluster. For more information, see Configure a shared NAS volume.
Step 1: Use PyTorch Profiler to identify the performance bottlenecks of a PyTorch ResNet-50 model
PyTorch 1.8.1 and later versions provide PyTorch Profiler to identify the performance bottlenecks of a model during training and inference. PyTorch Profiler can work with TensorBoard, which visualizes the analytical report of PyTorch Profiler.
Run the following commands to generate the PyTorch Profiler log:
NoteFor more information about the imagenet_classes.txt file in
with open("imagenet_classes.txt") as f:, see imagenet_classes.import torch from torchvision import models import torchvision.transforms as T from PIL import Image import time # Preprocess the image. def preprocess_image(img_path): transform = T.Compose([ T.Resize(224), T.CenterCrop(224), T.ToTensor(), T.Normalize(mean=[0.485, 0.456, 0.406], std=[0.229, 0.224, 0.225]),]) # Read the image. input_image = Image.open(img_path) # Convert the image format. input_data = transform(input_image) batch_data = torch.unsqueeze(input_data, 0) return batch_data # Postprocess the prediction result. def postprocess(output_data): # Read ImageNet classes. with open("imagenet_classes.txt") as f: classes = [line.strip() for line in f.readlines()] # Use Softmax to obtain the readable prediction result. confidences = torch.nn.functional.softmax(output_data, dim=1)[0] * 100 _, indices = torch.sort(output_data, descending=True) i = 0 # Print the prediction result. while confidences[indices[0][i]] > 0.5: class_idx = indices[0][i] print( "class:", classes[class_idx], ", confidence:", confidences[class_idx].item(), "%, index:", class_idx.item(), ) i += 1 def main(): model = models.resnet50(pretrained=True) input = preprocess_image("dog.jpg").cuda() model.eval() model.cuda() with torch.profiler.profile( activities=[ torch.profiler.ProfilerActivity.CPU, torch.profiler.ProfilerActivity.CUDA, ], on_trace_ready=torch.profiler.tensorboard_trace_handler('./logs'), profile_memory=True, record_shapes=True, with_stack=True ) as profiler: start = time.time() output = model(input) cost = time.time() - start print(f"predict_cost = {cost}") postprocess(output) profiler.step() if __name__ == '__main__': main()Use TensorBoard to visualize the analytical report.
Run the following commands to install PyTorch Profiler Tensorboard Plugin on your on-premises machine and start TensorBoard.
pip install torch_tb_profiler
tensorboard --logdir ./logs --port 6006
Enter localhost:6006 to the address bar of your browser and press Enter to view the analytical report.
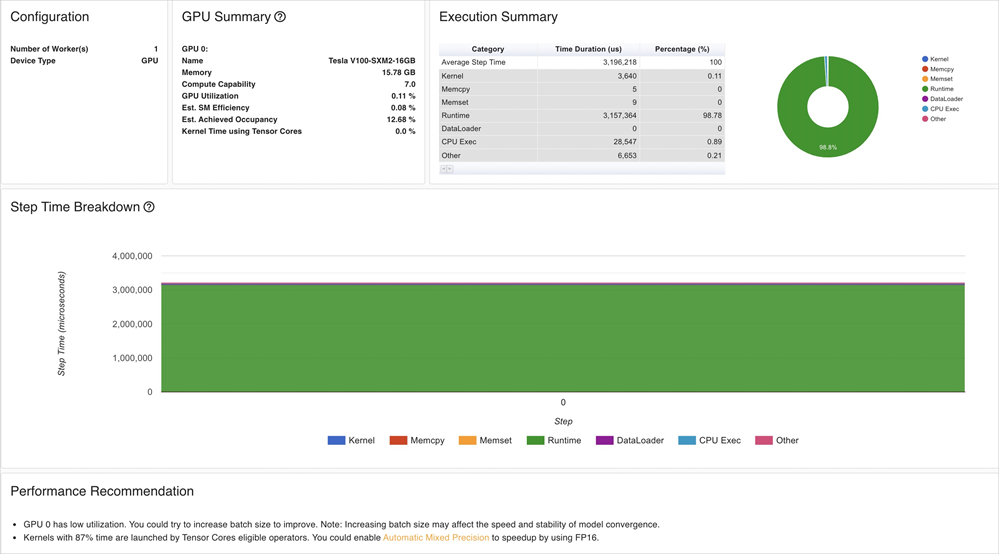
TensorBoard visualizes the analytical results, including metrics on GPU kernels, PyTorch operators, and timeline tracing. TensorBoard also provides suggestions on model optimization based on these metrics.

The analytical results indicate the following information:
The GPU utilization of the ResNet-50 model is low. You can increase the
batch sizeto improve the GPU utilization.It requires a long period of time to load GPU kernels. You can reduce the precision to accelerate the inference.
Step 2: Optimize the PyTorch ResNet-50 model
Before you use NVIDIA TensorRT to optimize the PyTorch ResNet-50 model, you must convert the model to the ONNX format and then create a TensorRT engine from the ONNX model file.
Run the following commands to convert the PyTorch model to the ONNX format:
# Load a pretrained ResNet-50 model.
model = models.resnet50(pretrained=True)

# Preprocess the image.
input = preprocess_image("dog.jpg").cuda()

# Perform model inference.
model.eval()
model.cuda()

# Convert the model to the ONNX format.
ONNX_FILE_PATH = "resnet50.onnx"
torch.onnx.export(model, input, ONNX_FILE_PATH, input_names=["input"], output_names=["output"], export_params=True)
onnx_model = onnx.load(ONNX_FILE_PATH)

# Check whether the conversion is successful.
onnx.checker.check_model(onnx_model)

print("Model was successfully converted to ONNX format.")
print("It was saved to", ONNX_FILE_PATH)
Create a TensorRT engine from the ONNX model file.
ImportantThe TensorRT version and Compute Unified Device Architecture (CUDA) version that are used to create the TensorRT engine must be compatible with the NVIDIA Inference Server version that is used in Step 4: Deploy the optimized model. In addition, the TensorRT version and CUDA version must be compatible with the GPU driver version and CUDA version of the Elastic Compute Service (ECS) instance on which the mode is deployed.
We recommend that you use the TensorRT image provided by NVIDIA. In this example, the image version of TensorRT is
nvcr.io/nvidia/tensorrt:21.05-py3and the image version of Triton Inference Server isnvcr.io/nvidia/tritonserver:21.05-py3.def build_engine(onnx_file_path, save_engine=False): if os.path.exists(TRT_ENGINE_PATH): # If a serialized engine exists, you can use the existing serialized engine instead of creating a new one. print("Reading engine from file {}".format(TRT_ENGINE_PATH)) with open(TRT_ENGINE_PATH, "rb") as f, trt.Runtime(TRT_LOGGER) as runtime: engine = runtime.deserialize_cuda_engine(f.read()) context = engine.create_execution_context() return engine, context # Initialize the TensorRT engine and parse the ONNX model. builder = trt.Builder(TRT_LOGGER) explicit_batch = 1 << (int)(trt.NetworkDefinitionCreationFlag.EXPLICIT_BATCH) network = builder.create_network(explicit_batch) parser = trt.OnnxParser(network, TRT_LOGGER) # Specify that the TensorRT engine can use at most 1 GB of GPU memory for policy selection. builder.max_workspace_size = 1 << 30 # In this example, only one image is included in the batch process. builder.max_batch_size = 1 # We recommend that you use the FP16 mode. if builder.platform_has_fast_fp16: builder.fp16_mode = True # Parse the ONNX model. with open(onnx_file_path, 'rb') as model: print('Beginning ONNX file parsing') parser.parse(model.read()) print('Completed parsing of ONNX file') # Create a TensorRT engine that is optimized for the platform on which the TensorRT engine is deployed. print('Building an engine...') engine = builder.build_cuda_engine(network) context = engine.create_execution_context() print("Completed creating Engine") with open(TRT_ENGINE_PATH, "wb") as f: print("Save engine to {}".format(TRT_ENGINE_PATH)) f.write(engine.serialize()) return engine, contextCompare the inference latency and model size between the original PyTorch model and the TensorRT engine.
Run the following commands to measure the inference latency of the original PyTorch model:
model = models.resnet50(pretrained=True)
input = preprocess_image("dog.jpg").cuda()
model.eval()
model.cuda()
start = time.time()
output = model(input)
cost = time.time() - start
print(f"pytorch predict_cost = {cost}")
Run the following commands to measure the inference latency of the TensorRT engine:
# Initialize the TensorRT engine and parse the ONNX model.
engine, context = build_engine(ONNX_FILE_PATH)
# Obtain the input data size and output data size. Allocate memory to process the input data and output data based on your business requirements.
for binding in engine:
    if engine.binding_is_input(binding):  # we expect only one input
        input_shape = engine.get_binding_shape(binding)
        input_size = trt.volume(input_shape) * engine.max_batch_size * np.dtype(np.float32).itemsize  # in bytes
        device_input = cuda.mem_alloc(input_size)
    else:  # The output data.
        output_shape = engine.get_binding_shape(binding)
        # Create a page-locked memory buffer. This way, the data is not written to the disk.
        host_output = cuda.pagelocked_empty(trt.volume(output_shape) * engine.max_batch_size, dtype=np.float32)
        device_output = cuda.mem_alloc(host_output.nbytes)
# Create a stream, copy the input data or output data to the stream, and then run inference.
stream = cuda.Stream()
# Preprocess the input data.
host_input = np.array(preprocess_image("dog.jpg").numpy(), dtype=np.float32, order='C')
cuda.memcpy_htod_async(device_input, host_input, stream)
# Run inference.
start = time.time()
context.execute_async(bindings=[int(device_input), int(device_output)], stream_handle=stream.handle)
cuda.memcpy_dtoh_async(host_output, device_output, stream)
stream.synchronize()
cost = time.time() - start
print(f"tensorrt predict_cost = {cost}")
The following table and figure show the results which include the inference latency and model size.
Metric
PyTorch Model
TensorRT Engine
Latency
16 ms
3 ms
Size
98 MB
50 MB

The results show that the inference latency of the TensorRT engine is about 80% lower than that of the original PyTorch model, and the size of the TensorRT engine is about 50% smaller than that of the original PyTorch model.
Step 3: Perform stress tests on the model
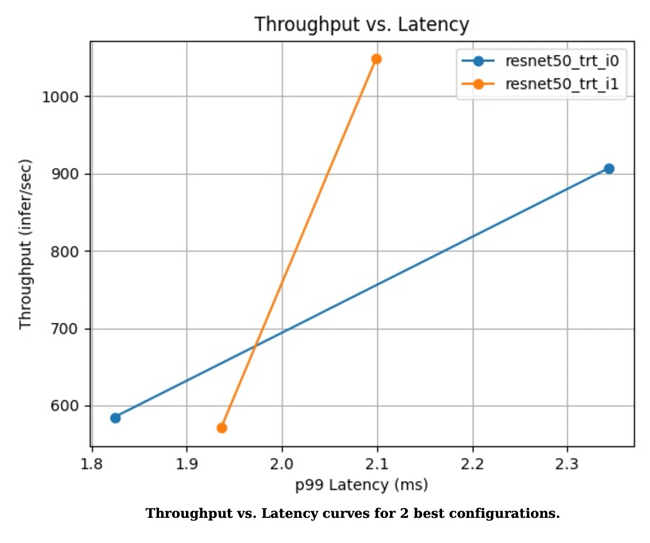
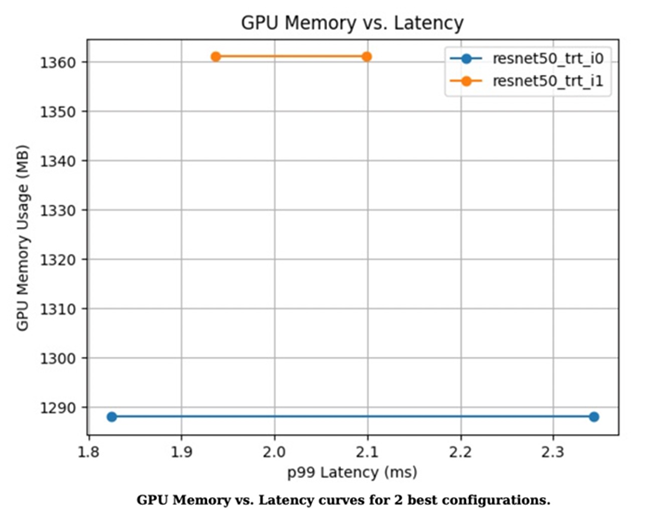
Before you use Triton Inference Server to deploy the optimized model, you can use Triton Model Analyzer to perform stress tests on the model. This allows you to check whether the inference latency, throughput, and GPU memory utilization of the model are optimized as expected. For more information about Triton Model Analyzer, see Triton Model Analyzer.
Run the following command to analyze the model.
After you run the following command, a folder named output_model_repository is created in the current directory to store the results of the profile subcommand.
model-analyzer profile -m /triton_repository/ \
    --profile-models resnet50_trt \
    --run-config-search-max-concurrency 2 \
    --run-config-search-max-instance-count 2 \
    --run-config-search-preferred-batch-size-disable true
Run the following command to generate the analytical report.
You can run the
analyzesubcommand ofTriton Model Analyzerto export the analytical results to PDF files.mkdir analysis_results model-analyzer analyze --analysis-models resnet50_trt -e analysis_resultsView the analytical report.
Figure 1. Throughput versus latency curve of the two best configurations

Figure 2. GPU memory utilization versus latency curve of the two best configurations

Figure 3. Performance metrics of the two models

Step 4: Deploy the optimized model
If the optimizations meet your requirements, you can use Arena to deploy the optimized model in your ACK cluster.
Modify the config.pbtxt file based on the following sample code:
name: "resnet50_trt"
platform: "tensorrt_plan"
max_batch_size: 1
default_model_filename: "resnet50.trt"
input [
    {
        name: "input"
        format: FORMAT_NCHW
        data_type: TYPE_FP32
        dims: [ 3, 224, 224 ]
    }
]
output [
    {
        name: "output",
        data_type: TYPE_FP32,
        dims: [ 1000 ]
    }
]
Run the following command to deploy the optimized model as an inference service by using Arena:
If you deploy the inference service on shared GPUs, you can set
--gpumemorybased on the recommendations of the analytical report generated in Step 3: Perform stress tests on the model. In this example, the recommended value is 2 GB.arena serve triton \ --name=resnet50 \ --gpus=1 \ --replicas=1 \ --image=nvcr.io/nvidia/tritonserver:21.05-py3 \ --data=model-pvc:/data \ --model-repository=/data/profile/pytorch \ --allow-metrics=trueRun the following command to query the details about the inference service:
arena serve listExpected output:
NAME      TYPE    VERSION       DESIRED  AVAILABLE  ADDRESS         PORTS                   GPU
resnet50  Triton  202111121515  1        1          172.16.169.126  RESTFUL:8000,GRPC:8001  1
Use a gRPC client to call the inference service deployed in your ACK cluster.
img_file = "dog.jpg"
service_grpc_endpoint = "172.16.248.19:8001"

# Create a grpc stub that is used to communicate with the server.
channel = grpc.insecure_channel(service_grpc_endpoint)
grpc_stub = service_pb2_grpc.GRPCInferenceServiceStub(channel)

# Make sure that the model meets the requirements and obtain some attributes of the model to be preprocessed.
metadata_request = service_pb2.ModelMetadataRequest(
    name=model_name, version=model_version)
metadata_response = grpc_stub.ModelMetadata(metadata_request)
config_request = service_pb2.ModelConfigRequest(name=model_name,
                                                version=model_version)
config_response = grpc_stub.ModelConfig(config_request)
input_name, output_name, c, h, w, format, dtype = parse_model(
    metadata_response, config_response.config)
request = requestGenerator(input_name, output_name, c, h, w, format, dtype, batch_size, img_file)
start = time.time()
response = grpc_stub.ModelInfer(request)
cost = time.time() - start
print("predict cost: {}".format(cost))
View monitoring data.
You can send requests to
/metricsthrough port 8002 to query monitoring data. In this example,172.16.169.126:8002/metricsis used.#HELP nv_inference_request_success Number of successful inference requests, all batch sizes #TYPE nv_inference_request_success counter nv_inference_request_success{gpu_uuid="GPU-0e9fdafb-5adb-91cd-26a8-308d34357efc",model="resnet50_trt",version="1"} 4.000000 #HELP nv_inference_request_failure Number of failed inference requests, all batch sizes # TYPE nv_inference_request_failure counter nv_inference_request_failure{gpu_uuid="GPU-0e9fdafb-5adb-91cd-26a8-308d34357efc",model="resnet50_trt",version="1"} 0.000000 #HELP nv_inference_count Number of inferences performed #TYPE nv_inference_count counter nv_inference_count{gpu_uuid="GPU-0e9fdafb-5adb-91cd-26a8-308d34357efc",model="resnet50_trt",version="1"} 4.000000 #HELP nv_inference_exec_count Number of model executions performed #TYPE nv_inference_exec_count counter nv_inference_exec_count{gpu_uuid="GPU-0e9fdafb-5adb-91cd-26a8-308d34357efc",model="resnet50_trt",version="1"} 4.000000 #HELP nv_inference_request_duration_us Cumulative inference request duration in microseconds #TYPE nv_inference_request_duration_us counter nv_inference_request_duration_us{gpu_uuid="GPU-0e9fdafb-5adb-91cd-26a8-308d34357efc",model="resnet50_trt",version="1"} 7222.000000 #HELP nv_inference_queue_duration_us Cumulative inference queuing duration in microseconds #TYPE nv_inference_queue_duration_us counter nv_inference_queue_duration_us{gpu_uuid="GPU-0e9fdafb-5adb-91cd-26a8-308d34357efc",model="resnet50_trt",version="1"} 116.000000 #HELP nv_inference_compute_input_duration_us Cumulative compute input duration in microseconds #TYPE nv_inference_compute_input_duration_us counter nv_inference_compute_input_duration_us{gpu_uuid="GPU-0e9fdafb-5adb-91cd-26a8-308d34357efc",model="resnet50_trt",version="1"} 1874.000000 #HELP nv_inference_compute_infer_duration_us Cumulative compute inference duration in microseconds #TYPE nv_inference_compute_infer_duration_us counter nv_inference_compute_infer_duration_us{gpu_uuid="GPU-0e9fdafb-5adb-91cd-26a8-308d34357efc",model="resnet50_trt",version="1"} 5154.000000 #HELP nv_inference_compute_output_duration_us Cumulative inference compute output duration in microseconds #TYPE nv_inference_compute_output_duration_us counter nv_inference_compute_output_duration_us{gpu_uuid="GPU-0e9fdafb-5adb-91cd-26a8-308d34357efc",model="resnet50_trt",version="1"} 66.000000 #HELP nv_gpu_utilization GPU utilization rate [0.0 - 1.0) #TYPE nv_gpu_utilization gauge nv_gpu_utilization{gpu_uuid="GPU-0e9fdafb-5adb-91cd-26a8-308d34357efc"} 0.000000 #HELP nv_gpu_memory_total_bytes GPU total memory, in bytes #TYPE nv_gpu_memory_total_bytes gauge nv_gpu_memory_total_bytes{gpu_uuid="GPU-0e9fdafb-5adb-91cd-26a8-308d34357efc"} 16945512448.000000 #HELP nv_gpu_memory_used_bytes GPU used memory, in bytes #TYPE nv_gpu_memory_used_bytes gauge nv_gpu_memory_used_bytes{gpu_uuid="GPU-0e9fdafb-5adb-91cd-26a8-308d34357efc"} 974913536.000000 #HELP nv_gpu_power_usage GPU power usage in watts #TYPE nv_gpu_power_usage gauge nv_gpu_power_usage{gpu_uuid="GPU-0e9fdafb-5adb-91cd-26a8-308d34357efc"} 55.137000 #HELP nv_gpu_power_limit GPU power management limit in watts #TYPE nv_gpu_power_limit gauge nv_gpu_power_limit{gpu_uuid="GPU-0e9fdafb-5adb-91cd-26a8-308d34357efc"} 300.000000 #HELP nv_energy_consumption GPU energy consumption in joules since the Triton Server started #TYPE nv_energy_consumption counter nv_energy_consumption{gpu_uuid="GPU-0e9fdafb-5adb-91cd-26a8-308d34357efc"} 9380.053000Triton Inference Server provides Prometheus metrics. You can use Grafana to display the Prometheus metrics that are collected from Triton Inference Server. For more information, see Connect Log Service to Grafana.
The cloud-native AI component set is optimized to simplify model analysis and evaluation. For more information, see Analyze and optimize models.