Service Mesh (ASM) generates metrics for all inbound, outbound, and service-to-service traffic, tracking request count, error rate, and response time. Over time, idle metrics accumulate in Envoy sidecar proxies, consuming memory and increasing the network load each time Prometheus scrapes the data.
Periodic metric cleanup evicts stale metrics from the Envoy cache, reducing memory consumption and lowering Prometheus scrape overhead.
Prerequisites
Before you begin, make sure that you have:
An ASM instance of version 1.18 or later with a cluster added. For more information, see Add a cluster to an ASM instance
Configure the cleanup interval
-
Log on to the ASM console. In the left-side navigation pane, choose .
-
On the Mesh Management page, click the name of the ASM instance. In the left-side navigation pane, choose .
On the Observability Settings page, click the Global tab. In the Enable Periodic Cleaning of Metrics section, enter a duration in the Periodic Cleaning Time of Metrics field, and then click Submit.
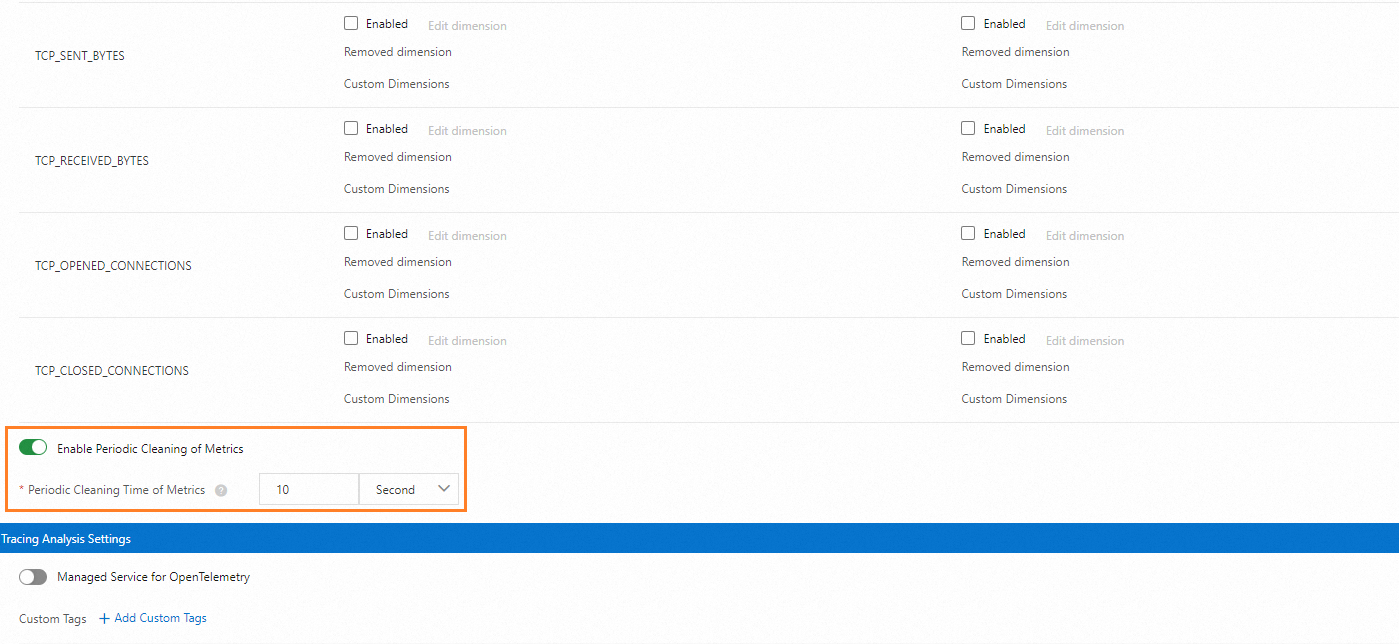
We recommend that you set the cleanup interval to at least twice the scrape_interval configured in Prometheus to ensure that Prometheus can successfully capture the metrics before they are cleaned up.
Verify periodic metric cleanup
The following walkthrough deploys a sample application, generates traffic to produce metrics, enables periodic cleanup, and confirms that stale metrics are evicted.
Step 1: Deploy the sample application
Deploy the
httpbinandsleepworkloads on the data plane cluster. For details about applying YAML templates, see Create using a YAML template.Verify that both Pods are running with sidecar proxies injected (2/2 containers ready):
kubectl get podExpected output:
NAME                       READY   STATUS    RESTARTS   AGE
httpbin-846bxxx694-xxxxx   2/2     Running   0          44s
sleep-866xxx97f9-xxxxx     2/2     Running   0          44s
Step 2: Enable the REQUEST_COUNT metric
-
Log on to the ASM console. In the left-side navigation pane, choose .
-
On the Mesh Management page, click the name of the ASM instance. In the left-side navigation pane, choose .
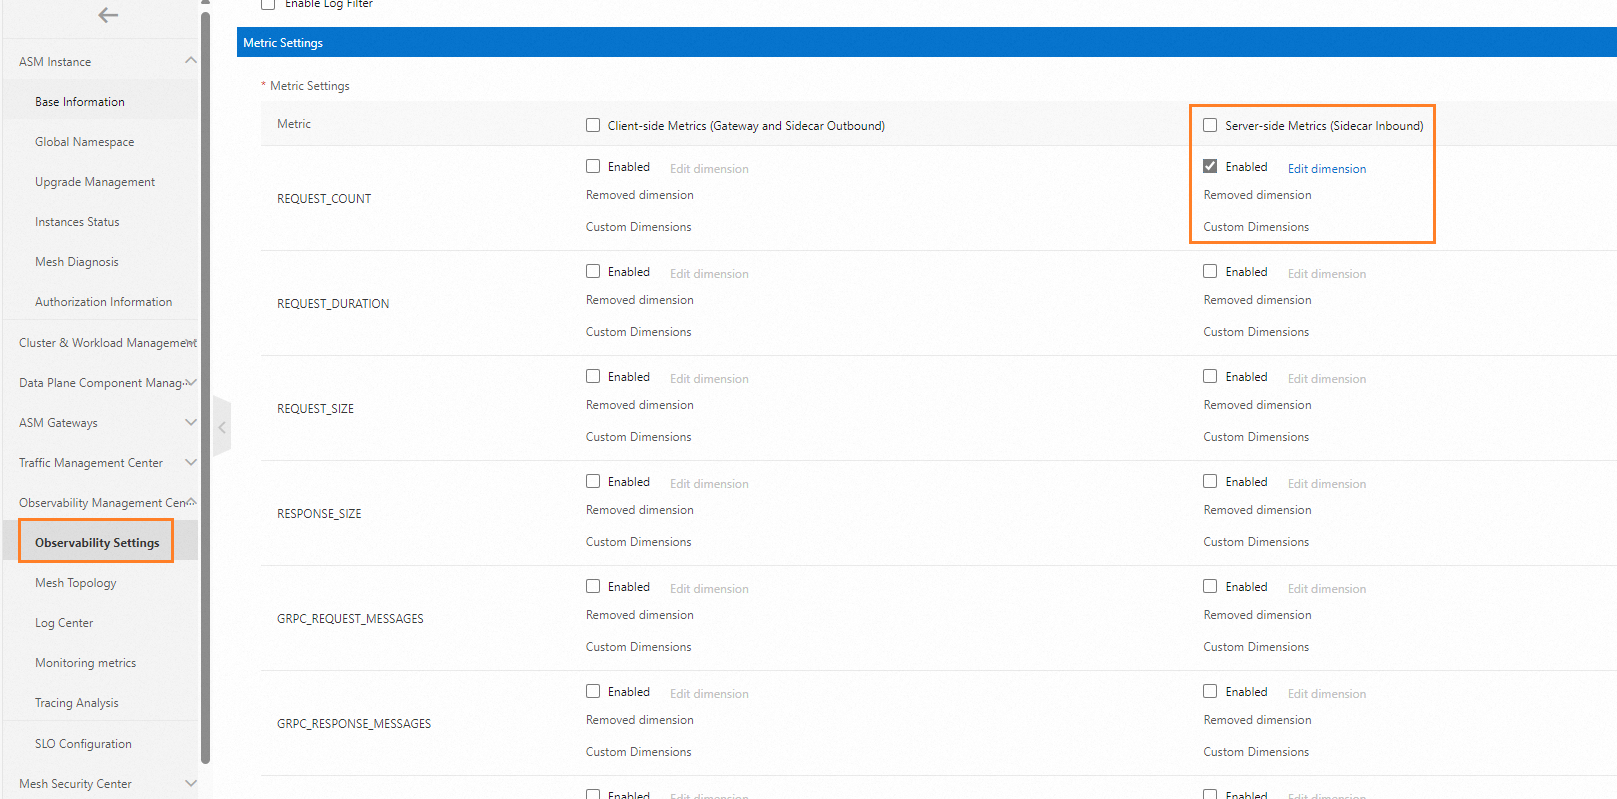
On the Observability Settings page, click the Global tab. In the Monitoring Metrics Setting list, select Enabled next to REQUEST_COUNT in the Server-side Metrics column. Click Submit.
Step 3: Generate traffic and check metrics
Send 10 requests from sleep to httpbin:
kubectl exec -it deploy/sleep -- sh -c 'for i in $(seq 1 10); do curl -s httpbin:8000/status/418 > /dev/null; done'Query the istio_requests_total metric from the httpbin sidecar proxy:
kubectl exec -it deploy/httpbin -c istio-proxy -- curl 0.0.0.0:15020/stats/prometheus | grep istio_requests_total{Expected output:
istio_requests_total{reporter="destination",source_workload="sleep",source_canonical_service="sleep",...,request_protocol="http",response_code="418",grpc_response_status="",response_flags="-",connection_security_policy="mutual_tls"} 20The metric shows accumulated request counts, confirming that server-side metrics are being recorded.
Step 4: Enable periodic cleanup and verify eviction
Set the Periodic Cleaning Time of Metrics to
10sby following the steps in Configure the cleanup interval.Cleanup takes effect after a delay of a few seconds. Adjust the cleanup time as needed during testing.
Run the following command to query the metric twice with a 15-second interval:
kubectl exec -it deploy/httpbin -c istio-proxy -- sh -c 'for i in $(seq 1 2); do echo "# Current content of the istio_requests_total metric: "; curl -s 0.0.0.0:15020/stats/prometheus | grep istio_requests_total{; sleep 15; done'Expected output:
# Current content of the istio_requests_total metric:
istio_requests_total{reporter="destination",source_workload="sleep",source_canonical_service="sleep",...connection_security_policy="mutual_tls"} 30
# Current content of the istio_requests_total metric:
The test command sends 2 requests in total. The first query returns the metric with the accumulated count along with a line of custom output. After 15 seconds, the second query returns only the custom output line -- the metric data is absent because the periodic cleanup has evicted the stale metric within the 15-second interval.