Connect your mobile app's frontend monitoring data with backend traces for full-stack visibility into every user request, from tap to server response and back.
Real User Monitoring (RUM) captures what happens on the user's device. Application Monitoring captures what happens on your servers. End-to-end tracing links the two: trace a slow or failed request from the mobile app all the way through your backend services to find the root cause.
How it works
When end-to-end tracing is enabled, the RUM SDK injects a trace context header into every HTTP request your app sends to your own services. The backend agent reads this header and creates a parent-child relationship between the frontend request span and the backend processing span.
ARMS supports two propagation protocols:
| Protocol | Header format | When to use |
|---|---|---|
| W3C Trace Context (OpenTelemetry) | traceparent: {version}-{trace-id}-{parent-id}-{trace-flags} and tracestate: rum={version}&{appType}&{pid}&{sessionId} | Your backend uses the ARMS agent or OpenTelemetry |
| sw8 (SkyWalking v8.x) | sw8: {sample}-{trace-id}-{segment-id}-{0}-{service}-{instance}-{endpoint}-{peer} | Your backend uses a SkyWalking v8.x agent |
Prerequisites
Before you begin, make sure that:
Your mobile app (Android or iOS) is monitored in RUM. See Monitor apps
The RUM SDK version is 0.2.0 or later
Your backend is monitored in Application Monitoring or Managed Service for OpenTelemetry. See Integration center
Your backend provides an HTTP-based web service that can parse and propagate request headers
Step 1: Add your service domain and enable tracing
Configure the RUM SDK to inject trace context headers into requests sent to your backend services.
Log on to the ARMS console.
In the left-side navigation pane, choose . In the top navigation bar, select the region where your app resides.
Find your app and choose Choose More > More Configurations in the Actions column. On the application details page, click the Application Settings tab.
Click the Request Management tab.
Click Add own service and enter your service domain.
ImportantOnly add domains that belong to your own services. Third-party servers do not recognize or propagate trace headers, so adding a third-party domain prevents tracing from working.
In the Add own service dialog box, turn on Link open and select the tracing protocol that matches your backend agent.
NoteFor OpenTelemetry integration, see Integrate services or components.
Click OK.
The configuration is automatically pushed to your app. Note the following behavior:
The RUM SDK pulls the latest configuration on cold start and again when the app returns to the foreground after running in the background for more than 30 seconds. Configuration changes may take a few minutes to reach all users.
Your server gateway must be able to propagate trace context headers. If the gateway strips or ignores these headers, the backend cannot participate in the trace. This applies even though cross-origin resource sharing (CORS) does not affect native mobile apps.
Step 2: Verify frontend tracing
After the configuration is pushed to your app, verify that the RUM SDK is injecting trace headers into outgoing HTTP requests.
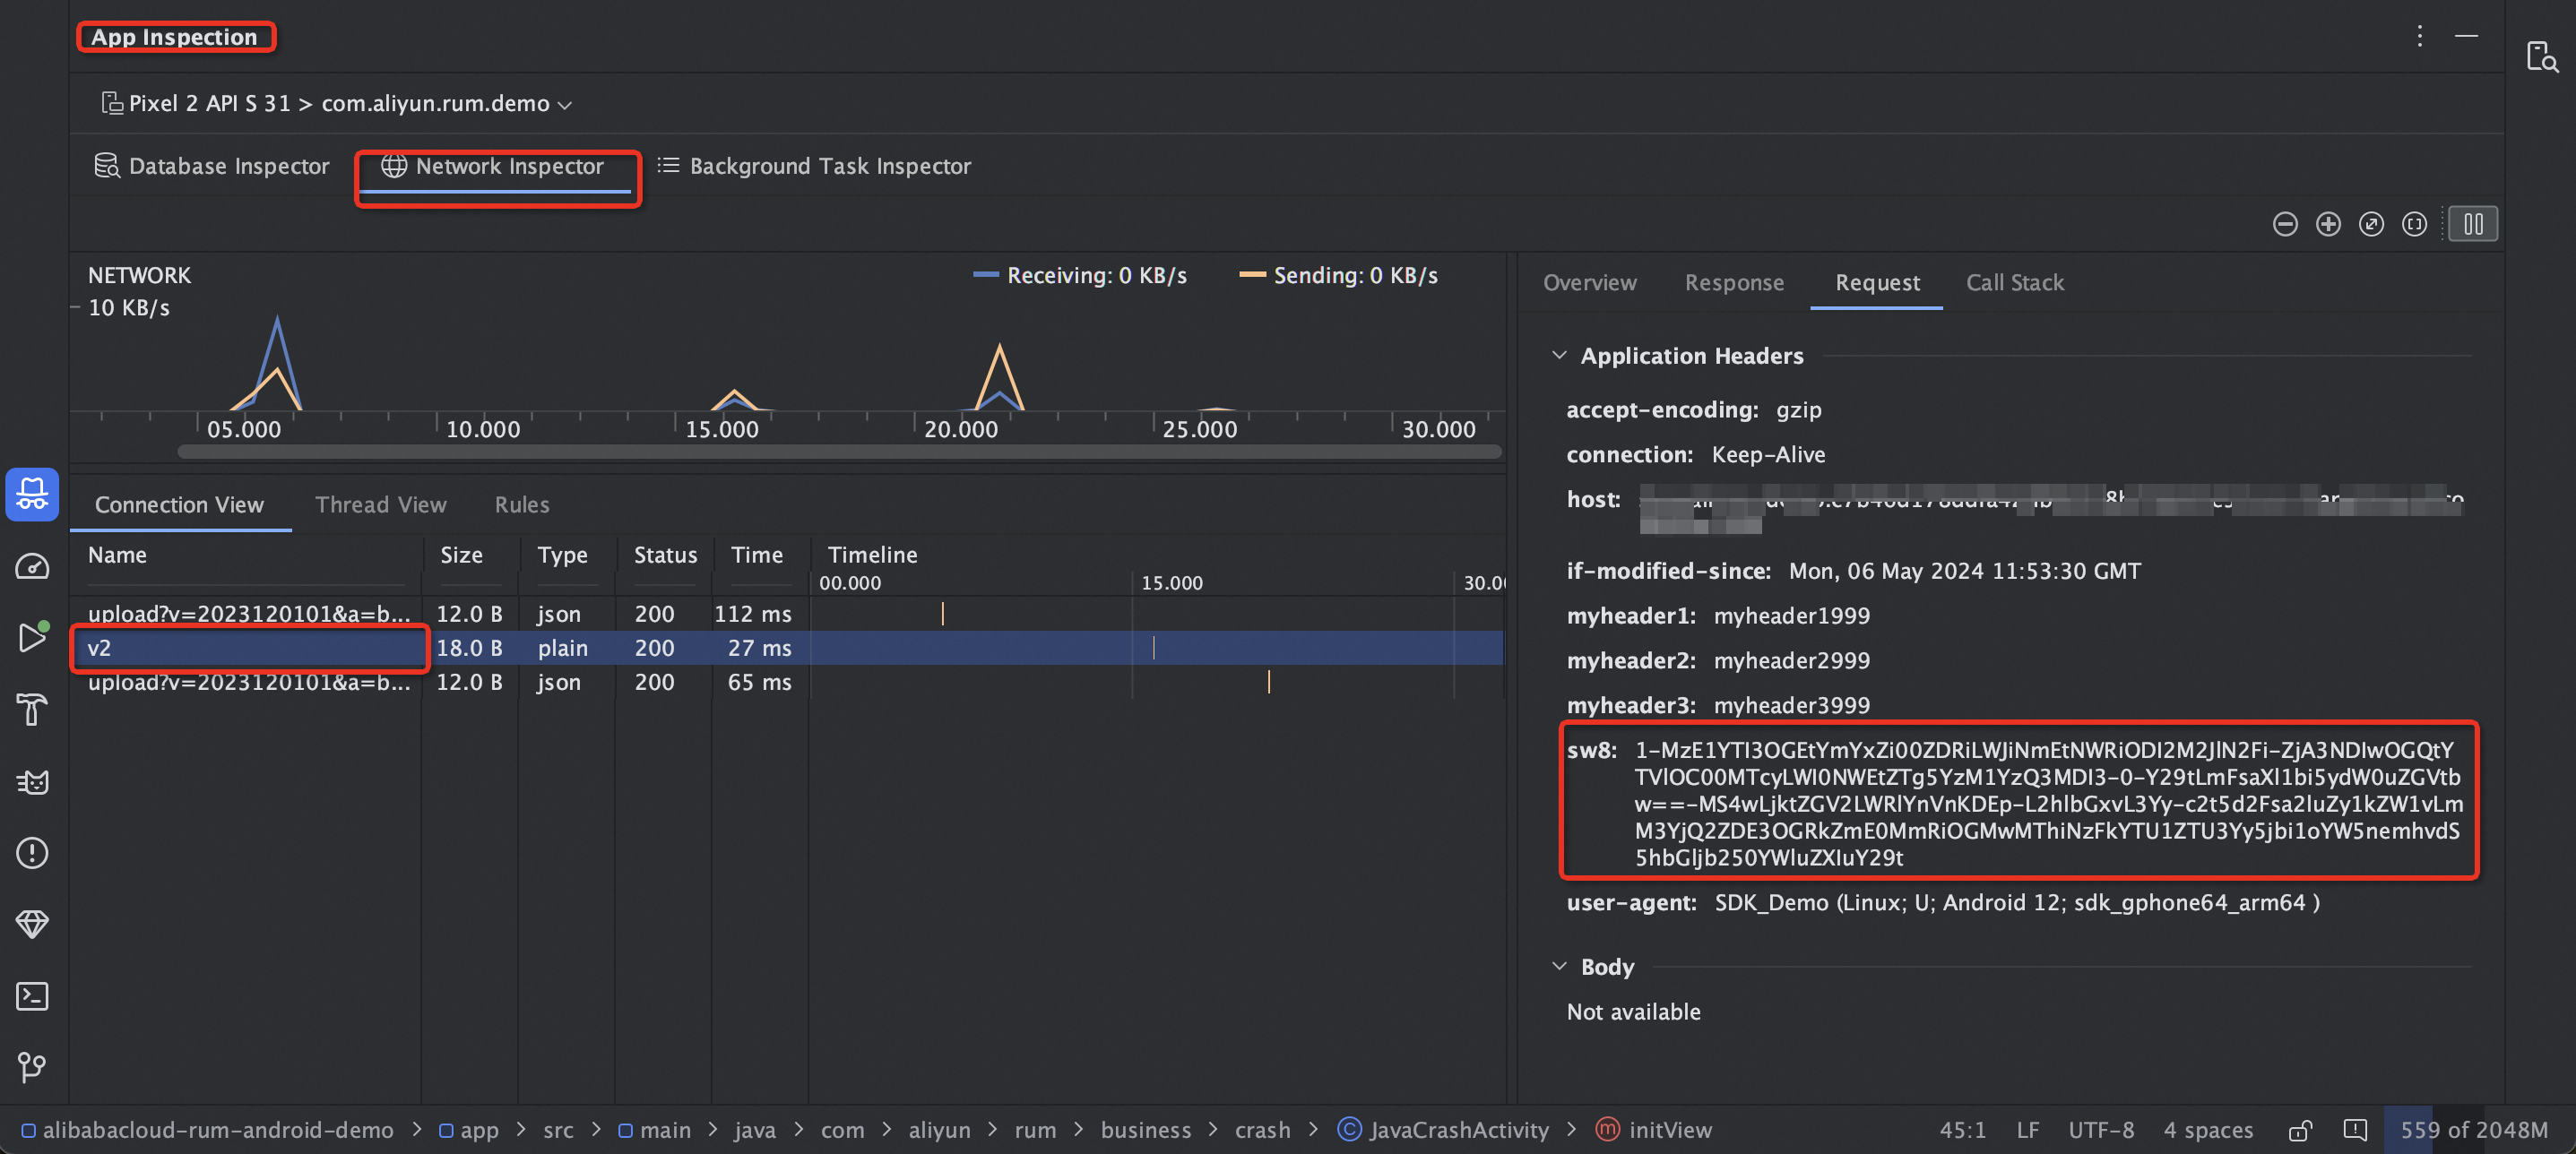
Android
Open your project in Android Studio.
Run your app on a device or emulator.
Open App Inspection in Android Studio.
Trigger a network request in your app and inspect the request headers. If you see an
sw8ortraceparentheader (depending on the protocol you selected), tracing is configured correctly.
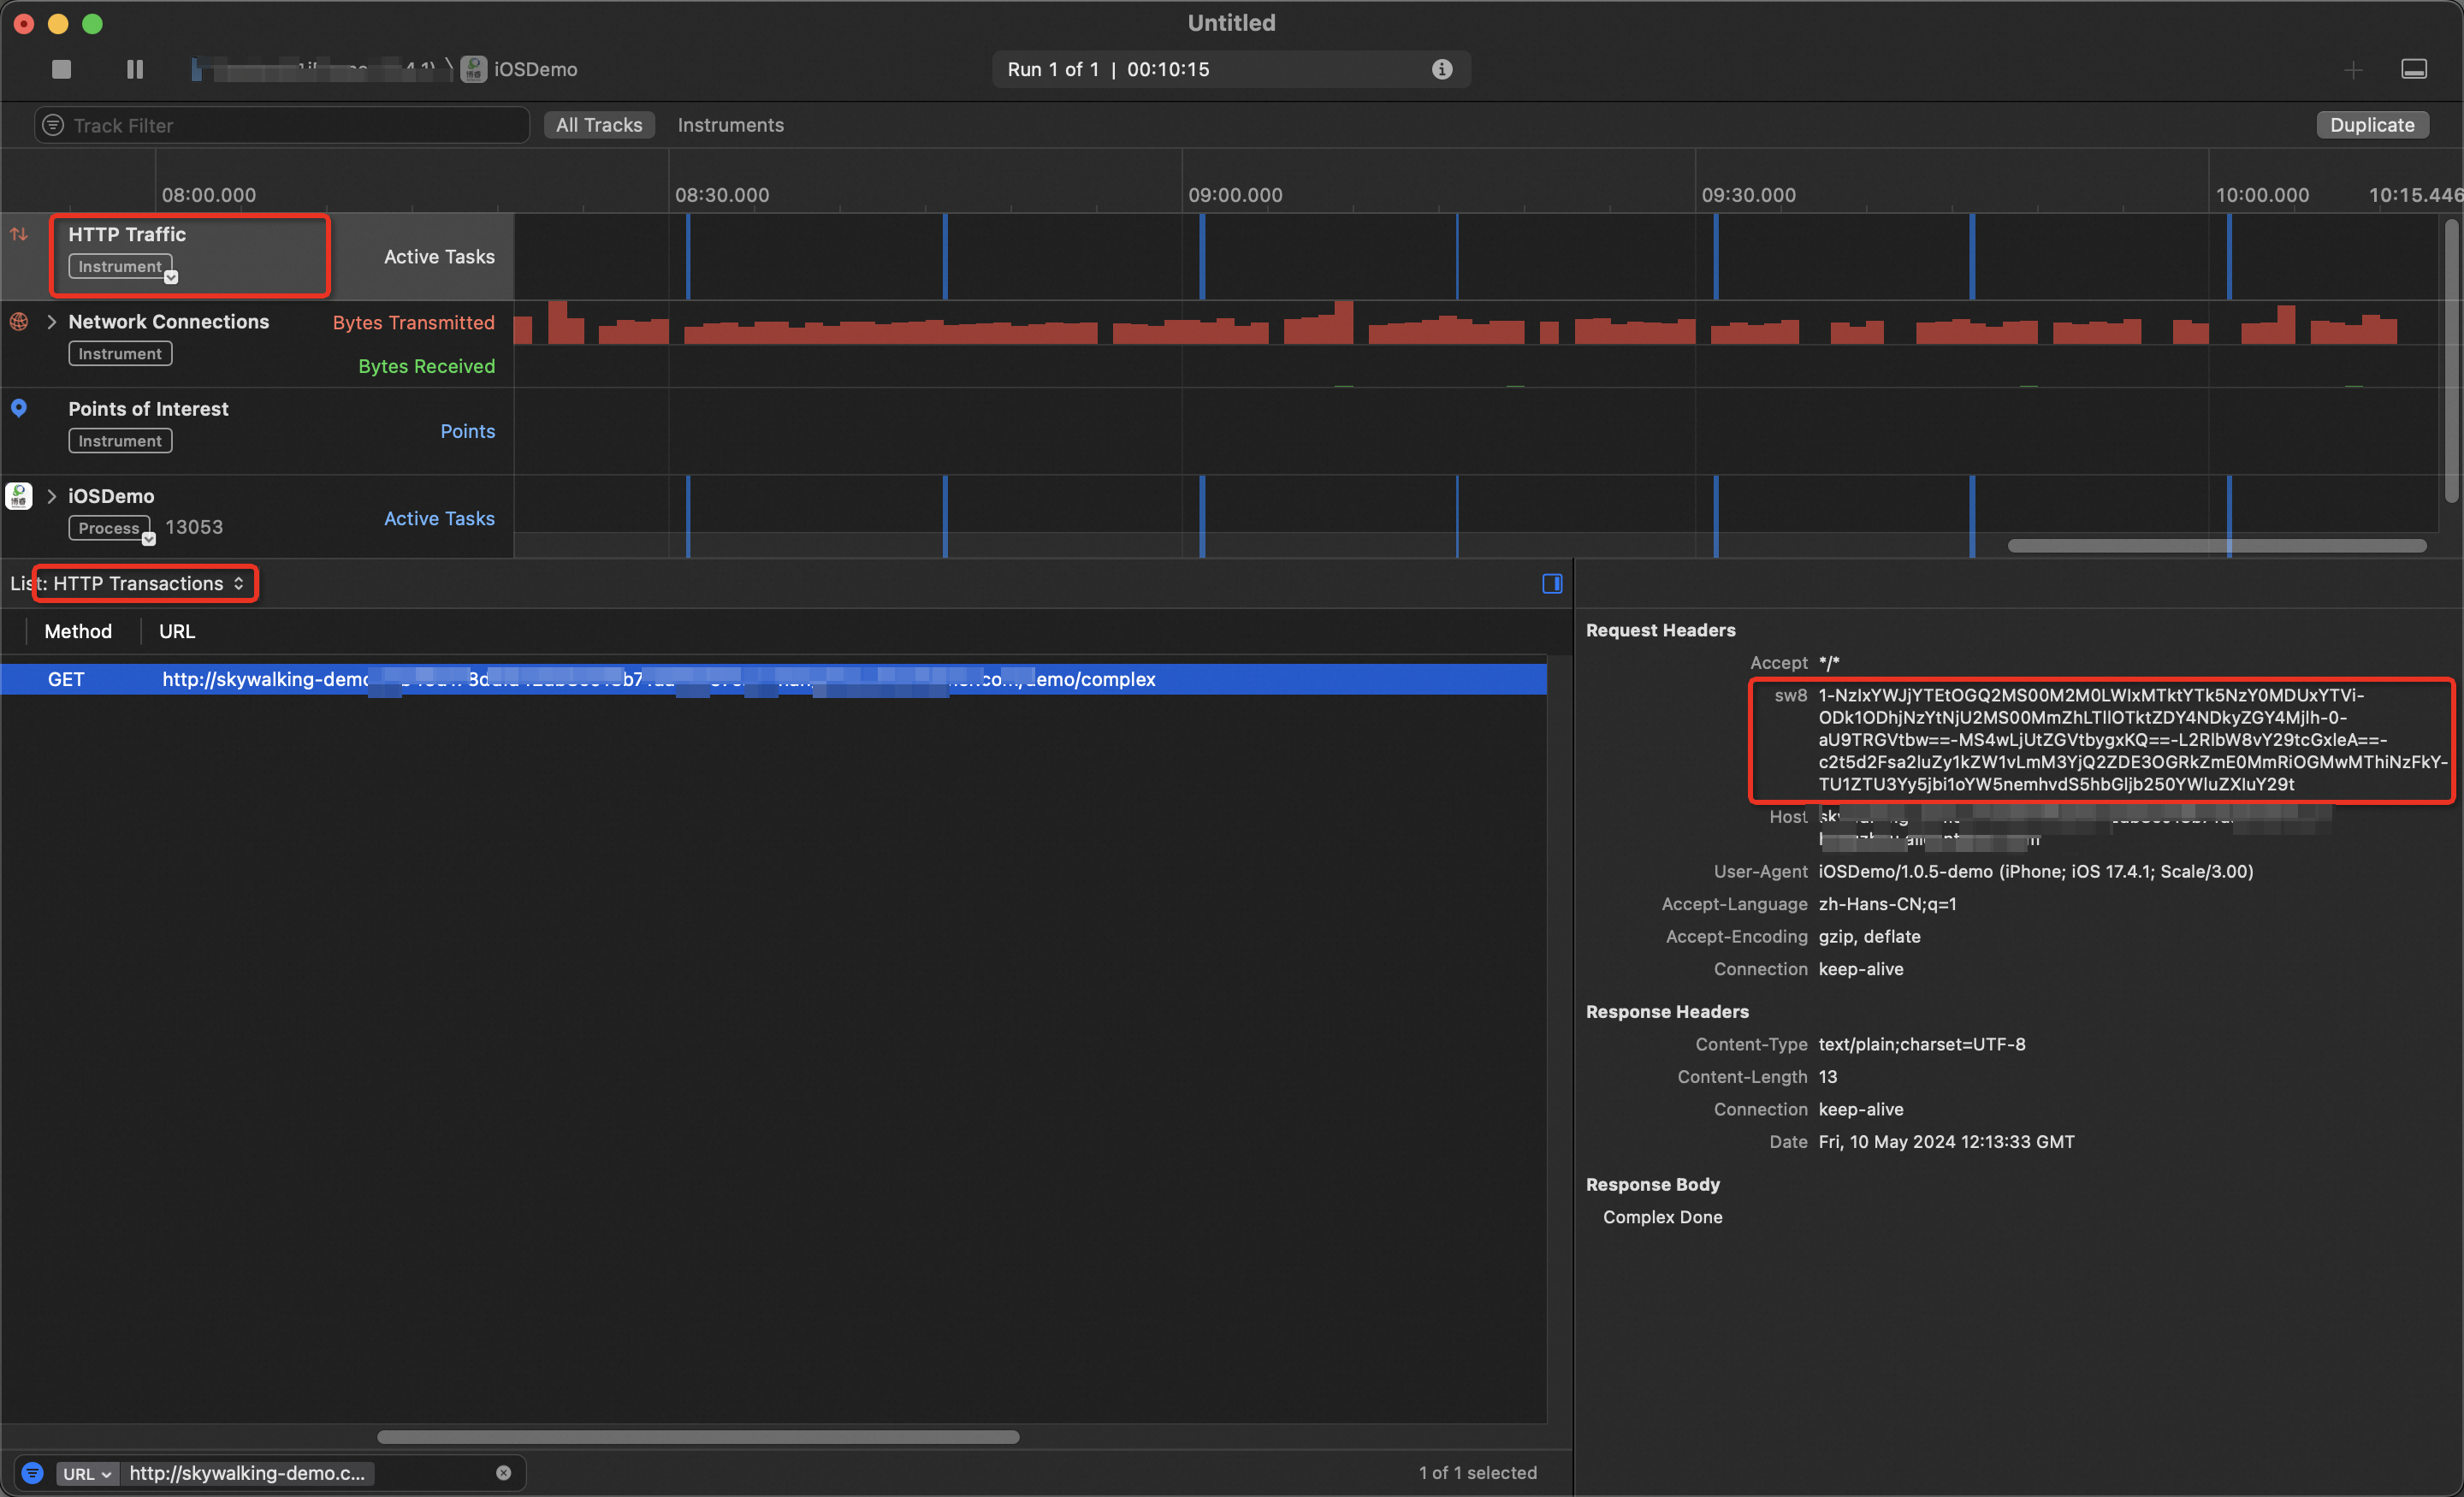
iOS
Open your project in Xcode.
Choose Product > Profile to launch Instruments.
Select the Network template to capture HTTP traffic.
Trigger a network request in your app and inspect the request headers. If you see an
sw8ortraceparentheader, tracing is configured correctly.
Step 3: Enable backend tracing
The frontend is now injecting trace context headers. Next, configure your backend to read these headers and continue the trace. The setup depends on your language and agent.
Java
ARMS agent (recommended)
The ARMS agent supports the OpenTelemetry protocol by default. If your Java application is already monitored with Application Monitoring, end-to-end tracing works without additional configuration.
Requirements:
ARMS agent version V2.x, V3.x, or V4.x. V4.x is recommended for better user experience
A supported web container: Apache Tomcat, Jetty, WebLogic, or Undertow
A supported framework: Spring Boot or Spring Web MVC. See Java components and frameworks supported by ARMS
To install the ARMS agent, see Monitor Java applications.
OpenTelemetry (automatic instrumentation)
If you use OpenTelemetry with automatic instrumentation, tracing works without additional configuration because OpenTelemetry supports most mainstream Java frameworks. See Use OpenTelemetry to report the trace data of Java applications.
OpenTelemetry (manual instrumentation)
If you manually instrument your app, parse the traceparent and tracestate headers from frontend requests to continue the trace. The following example shows how to do this in a Spring Boot application.
1. Add OpenTelemetry dependencies:
<dependency>
  <groupId>io.opentelemetry</groupId>
  <artifactId>opentelemetry-api</artifactId>
</dependency>
<dependency>
  <groupId>io.opentelemetry</groupId>
  <artifactId>opentelemetry-sdk-trace</artifactId>
</dependency>
<dependency>
  <groupId>io.opentelemetry</groupId>
  <artifactId>opentelemetry-extension-annotations</artifactId>
  <version>1.18.0</version>
</dependency>
<dependency>
  <groupId>io.opentelemetry</groupId>
  <artifactId>opentelemetry-exporter-otlp</artifactId>
</dependency>
<dependency>
  <groupId>io.opentelemetry</groupId>
  <artifactId>opentelemetry-sdk</artifactId>
</dependency>
<dependency>
  <groupId>io.opentelemetry</groupId>
  <artifactId>opentelemetry-semconv</artifactId>
  <version>1.30.1-alpha</version>
</dependency>
<dependency>
  <groupId>io.opentelemetry</groupId>
  <artifactId>opentelemetry-sdk-extension-autoconfigure</artifactId>
  <version>1.34.1</version>
</dependency>
<dependency>
  <groupId>io.opentelemetry</groupId>
  <artifactId>opentelemetry-extension-incubator</artifactId>
  <version>1.35.0-alpha</version>
</dependency>
2. Initialize OpenTelemetry with W3C propagation:
Resource resource = Resource.getDefault()
        .merge(Resource.create(Attributes.of(
                ResourceAttributes.SERVICE_NAME, "otel-demo",
                ResourceAttributes.HOST_NAME, "<your-hostname>"
        )));

SdkTracerProvider sdkTracerProvider = SdkTracerProvider.builder()
        .addSpanProcessor(BatchSpanProcessor.builder(OtlpHttpSpanExporter.builder()
                .setEndpoint("<your-endpoint>")
                .addHeader("Authentication", "<your-token>")
                .build()).build())
        .setResource(resource)
        .build();

// Enable W3C trace context propagation
openTelemetry = OpenTelemetrySdk.builder()
        .setTracerProvider(sdkTracerProvider)
        .setPropagators(ContextPropagators.create(
                TextMapPropagator.composite(
                    W3CTraceContextPropagator.getInstance(),
                    W3CBaggagePropagator.getInstance())))
        .buildAndRegisterGlobal();

tracer = ExtendedTracer.create(
        openTelemetry.getTracer("com.example.tracer", "1.0.0"));
Replace the following placeholders with your actual values:
| Placeholder | Description | Example |
|---|---|---|
<your-hostname> | Host name of your server | my-server-01 |
<your-endpoint> | OpenTelemetry collector endpoint | https://tracing-analysis-dc-hz.aliyuncs.com/... |
<your-token> | Authentication token | xXxXxXx |
3. Parse the trace context from request headers:
// In your @Controller, extract the trace context from the incoming request headers
@RequestMapping("/test")
public String test(@RequestHeader Map<String, String> headers) {
    Span span = OpenTelemetrySupport.getTracer()
            .spanBuilder("/test")
            // Set the parent span from the frontend request headers
            .setParentFrom(OpenTelemetrySupport.getContextPropagators(), headers)
            .setSpanKind(SpanKind.SERVER)
            .startSpan();
    try (Scope scope = span.makeCurrent()) {
        // Process the request
    } catch (Throwable t) {
        span.setStatus(StatusCode.ERROR, "handle parent span error");
    } finally {
        span.end();
    }
    return "success";
}
SkyWalking
Use a SkyWalking agent for Java to integrate your app with Managed Service for OpenTelemetry. See Use SkyWalking to report Java application data.
If you use a SkyWalking v8.x agent, select the sw8 protocol in Step 1.
Go
OpenTelemetry
Integrate your Go app with Managed Service for OpenTelemetry. See Use OpenTelemetry to submit the trace data of a Go application.
Then extract the span from the request context in your HTTP handler:
// Initialize the tracer
tracer := otel.Tracer(common.TraceInstrumentationName)

// Extract the span from the incoming request context
handler := http.HandlerFunc(func(w http.ResponseWriter, req *http.Request) {
    ctx := req.Context()
    span := trace.SpanFromContext(ctx)
    // Process the request
    w.Write([]byte("Hello World"))
})
SkyWalking
Use a SkyWalking agent for Go to integrate your app with Managed Service for OpenTelemetry. See Use SkyWalking to report Go application data.
The SkyWalking Go agent supports these web frameworks out of the box: Gin, go-restful, http, Kratos v2, Go Micro, and Go Resty. When you use the agent with a supported framework, tracing works without code changes.
To manually parse the trace context from request headers:
// Extract context from the sw8 HTTP request header
span, ctx, err := tracer.CreateEntrySpan(r.Context(), "/api/test", func(key string) (string, error) {
    return r.Header.Get(key), nil
})
Python
OpenTelemetry
Integrate your Python app with Managed Service for OpenTelemetry. See Use OpenTelemetry to report the trace data of Python applications.
Then parse the trace context from request headers. The following example uses Flask:
# Initialize the tracer
trace.set_tracer_provider(TracerProvider())
trace.get_tracer_provider().add_span_processor(
    BatchSpanProcessor(ConsoleSpanExporter()))

tracer = trace.get_tracer(__name__)

@app.route('/test')
def test():
    headers = dict(request.headers)

    # Parse the W3C trace context from the request headers
    carrier = {
        'traceparent': headers['Traceparent'],
        'tracestate': headers['Tracestate']
    }
    ctx = TraceContextTextMapPropagator().extract(carrier=carrier)

    with tracer.start_span("test", context=ctx):
        # Process the request
        return "success"
SkyWalking
Use SkyWalking to integrate your app with Managed Service for OpenTelemetry. See Use SkyWalking to report Python application data.
Then parse the trace context from the sw8 header:
from skywalking import config, agent
from skywalking.trace.context import SpanContext, get_context
from skywalking.trace.carrier import CarrierItem

# Configure SkyWalking
config.init(
    agent_collector_backend_services='<endpoint>',
    agent_authentication='<auth-token>')

agent.start()

def handle_request(headers):
    # Extract trace information from the request headers
    carrier_items = []
    for item in SpanContext.make_carrier():
        carrier_header = headers.get(item.key.lower())
        if carrier_header:
            carrier_items.append(CarrierItem(item.key, carrier_header))

    carrier = SpanContext.make_carrier(carrier_items)

    # Extract the trace context from the carrier
    context = get_context().extract(carrier)

    # Create a span that continues the frontend trace
    with get_context().new_entry_span(op='operation_name') as span:
        # Process the request
        ...

# Example: use a dictionary with SkyWalking segment IDs to simulate incoming request headers
incoming_headers = {
    'sw8': '1-My40LjU=-MTY1MTcwNDI5OTk5OA==-xxxx-xx-x-x==',
}

handle_request(incoming_headers)
Replace the following placeholders with your actual values:
| Placeholder | Description |
|---|---|
<endpoint> | SkyWalking collector backend service address |
<auth-token> | Authentication token for the collector |
Step 4: View the full trace
After both frontend and backend tracing are enabled, view the end-to-end trace data in the ARMS console.
In the RUM module, locate the request you want to investigate.
Click View Call Chain to see the complete trace, including all spans from the frontend request through your backend services.
The top span is the root span created by the RUM SDK. Root span naming follows this convention:
| App type | App name | Span name prefix |
|---|---|---|
| Web or HTML5 | rum-browser | browser.request: |
| Mini program | rum-miniapp | miniapp.request: |
| Android | rum-android | android.request: |
| iOS | rum-ios | ios.request: |
The trace view also includes a topology diagram that shows all upstream and downstream services involved in the request. Use it to identify which service is causing slowness or errors.