After you use OpenTelemetry to instrument an application and report the trace data to Managed Service for OpenTelemetry, Managed Service for OpenTelemetry starts to monitor the application. You can view the monitoring data of the application, such as application topologies, traces, abnormal transactions, slow transactions, and SQL analysis data. This topic describes how to use OpenTelemetry to automatically or manually instrument an Express-based Node.js application and report data.
Prerequisites
The Node.js version must be 14 or later. Otherwise, we recommend that you use Jaeger to submit the trace data of a Node.js application. For more information, see Report Node.js application data.
Log on to the Managed Service for OpenTelemetry console.
In the left-side navigation pane, click Cluster Configurations. On the page that appears, click the Access point information tab.
In the top navigation bar, select a region. In the Cluster Information section, turn on Show Token.
Set the Client parameter to OpenTelemetry.
Obtain the endpoint of Managed Service for OpenTelemetry in the Related Information column of the table in the lower part.
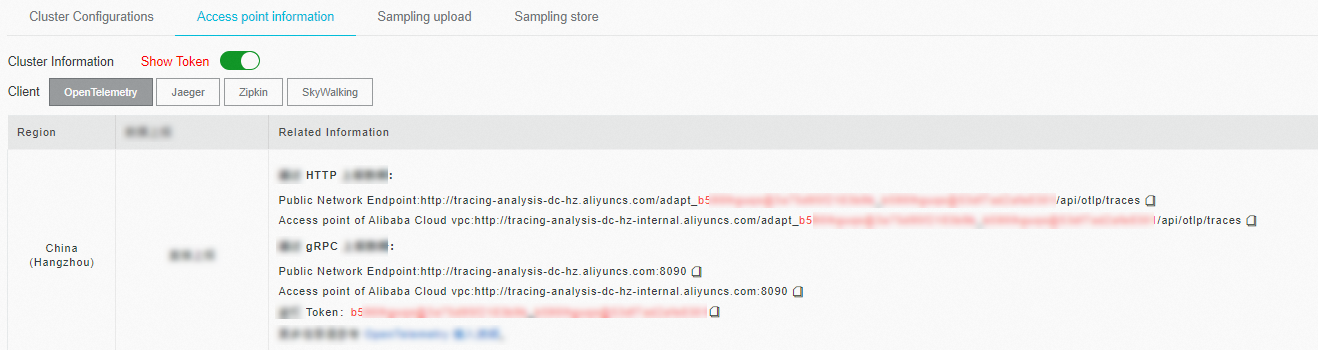 Note
NoteIf your application is deployed in an Alibaba Cloud production environment, use the Virtual Private Cloud (VPC) endpoint. Otherwise, use the public endpoint.
Background information
OpenTelemetry provides multiple automatic instrumentation plug-ins that can be used to automatically create spans for common frameworks. The following table describes the supported frameworks. For more information, see OpenTelemetry documentation.
Sample code
You can download the sample code from opentelemetry-nodejs-demo.
Method 1: Automatic instrumentation (recommended)
Download the dependencies required to run the project.
cd auto-instrumentation

npm init -y
npm install express
npm install axios
Download the dependencies required for OpenTelemetry automatic instrumentation.
npm install --save @opentelemetry/api
npm install --save @opentelemetry/auto-instrumentations-node
Write the application code.
The following code provides a simple example implemented by using Express:
"use strict";

const axios = require("axios").default;
const express = require("express");
const app = express();

app.get("/", async (req, res) => {
  const result = await axios.get("http://localhost:7001/hello");
  return res.status(201).send(result.data);
});

app.get("/hello", async (req, res) => {
  console.log("hello world!")
  res.json({ code: 200, msg: "success" });
});

app.use(express.json());

app.listen(7001, () => {
  console.log("Listening on http://localhost:7001");
});
Use environment variables to set OpenTelemetry parameters and run the application.
Replace
${httpEndpoint}with the HTTP endpoint obtained in Prerequisites. Replace${serviceName}with the application name.export OTEL_TRACES_EXPORTER="otlp" export OTEL_EXPORTER_OTLP_TRACES_ENDPOINT="${httpEndpoint}" export OTEL_NODE_RESOURCE_DETECTORS="env,host,os" export OTEL_SERVICE_NAME="${serviceName}" export NODE_OPTIONS="--require @opentelemetry/auto-instrumentations-node/register" node main.jsNoteFor information about OpenTelemetry environment variables, see Automatic Instrumentation Configuration.
Access the application.
Access the application by running the following command or using a browser. Then, you can generate traces and report the trace data to Managed Service for OpenTelemetry.
curl localhost:7001/hello
Method 2: Manual instrumentation
Add the following dependencies on OpenTelemetry to the package.json file.
 "dependencies": {
    "@opentelemetry/api": "^1.0.4",
    "@opentelemetry/exporter-trace-otlp-grpc": "^0.27.0",
    "@opentelemetry/instrumentation": "^0.27.0",
    "@opentelemetry/instrumentation-express": "^0.27.0",
    "@opentelemetry/instrumentation-http": "^0.27.0",
    "@opentelemetry/resources": "^1.0.1",
    "@opentelemetry/sdk-trace-base": "^1.0.1",
    "@opentelemetry/sdk-trace-node": "^1.0.1"
  }
Create a provider.
const { Resource } = require("@opentelemetry/resources");
const { NodeTracerProvider } = require("@opentelemetry/sdk-trace-node");
const {
  SemanticResourceAttributes,
} = require("@opentelemetry/semantic-conventions");

const provider = new NodeTracerProvider({
  resource: new Resource({
    [SemanticResourceAttributes.HOST_NAME]: require("os").hostname(),
    [SemanticResourceAttributes.SERVICE_NAME]: "opentelemetry-express",    // You can replace opentelemetry-express with the actual service name.
  }),
});
Register the HTTP and Express frameworks by using the provider. Applications in these frameworks are automatically monitored and intercepted.
NoteFor information about how to monitor Node.js applications in other frameworks, see OpenTelemetry documentation.
const { registerInstrumentations } = require("@opentelemetry/instrumentation");
const { HttpInstrumentation } = require("@opentelemetry/instrumentation-http");
const {
  ExpressInstrumentation,
} = require("@opentelemetry/instrumentation-express");

registerInstrumentations({
  tracerProvider: provider,
  instrumentations: [new HttpInstrumentation(), ExpressInstrumentation],
});
Configure an exporter to export data to Managed Service for OpenTelemetry.
Replace
<ENDPOINT>and<AUTHENTICATION>in the following code with the endpoint and token that are obtained in Prerequisites.const metadata = new grpc.Metadata(); metadata.set("Authentication", "<AUTHENTICATION>"); const exporter = new OTLPTraceExporter({ url: "<ENDPOINT>", metadata }); provider.addSpanProcessor(new SimpleSpanProcessor(exporter)); provider.register();Optional. Add a custom event and attributes.
NoteFor information about how to use the OpenTelemetry API, see OpenTelemetry documentation.
const api = require("@opentelemetry/api");
const currentSpan = api.trace.getSpan(api.context.active());
currentSpan.addEvent("timestamp", { value: Date.now() });
currentSpan.setAttribute("tagKey-01", "tagValue-01");
View trace data in the ARMS console
Log on to the ARMS console. In the left-side navigation pane, choose . On the Applications page, click the name of the application. On the page that appears, view the trace data.
If the  icon is displayed in the Language column, the application is connected to Application Monitoring. If a hyphen (-) is displayed, the application is connected to Managed Service for OpenTelemetry.