Before you can view the trace data of your application, you must use a client to report the trace data to Tracing Analysis. This topic describes how to use Jaeger SDK or the Jaeger agent to report Go application data. This topic also provides examples on how to use the two methods to report Go application data.
Prerequisites
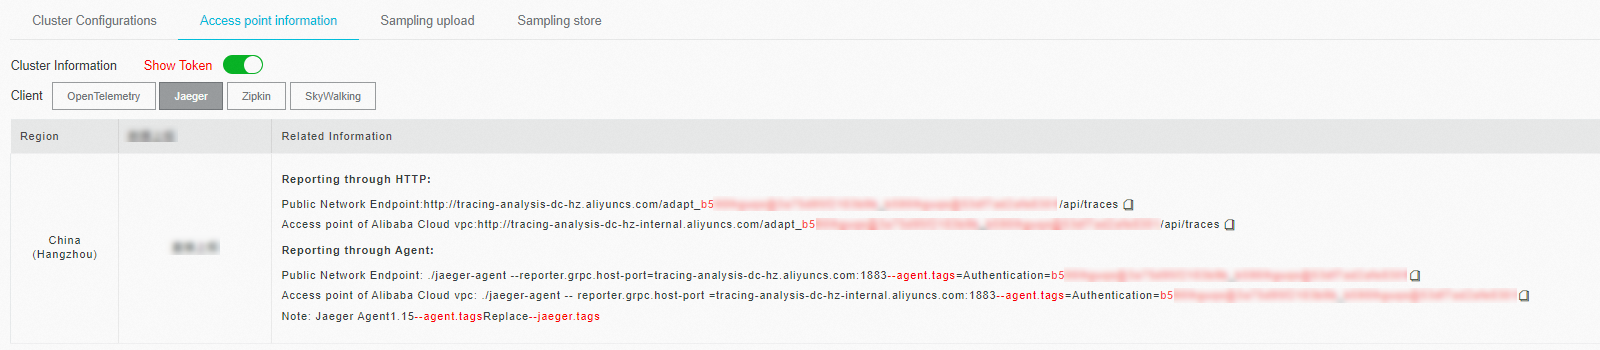
Log on to the Managed Service for OpenTelemetry console.
In the left-side navigation pane, click Cluster Configurations. Then, click the Access point information tab.
In the top navigation bar, select a region. In the Cluster Information section, turn on Show Token.
In the Client section, click Jaeger or Zipkin.
Obtain an endpoint of Jaeger or Zipkin in the Related Information column of the table in the lower part.
 Note
NoteIf your application is deployed in an Alibaba Cloud production environment, use a VPC endpoint. Otherwise, use a public endpoint. Generally, use the endpoint of v2 for Zipkin. Use the endpoint of v1 only if you know Zipkin well.
Background information
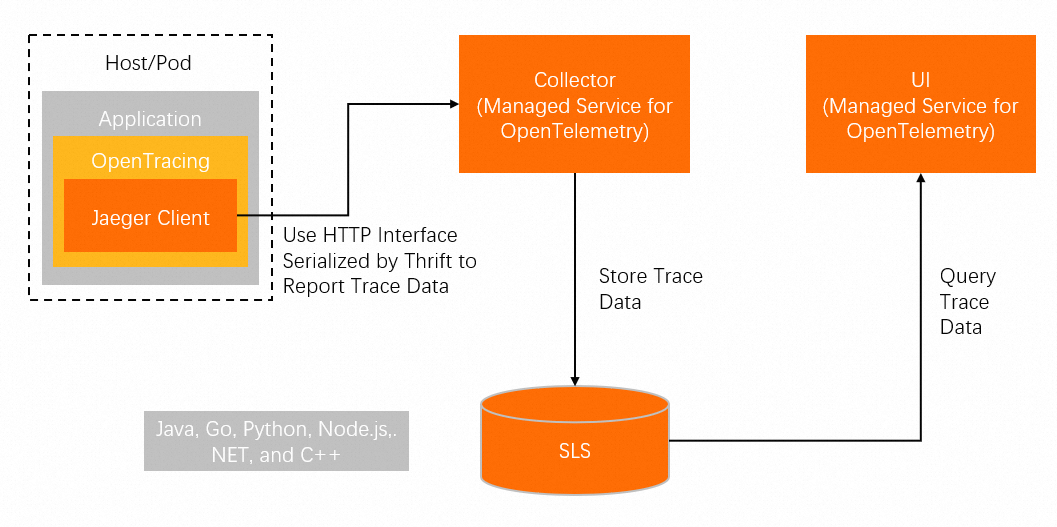
The following figure shows how to report data without using the Jaeger agent.
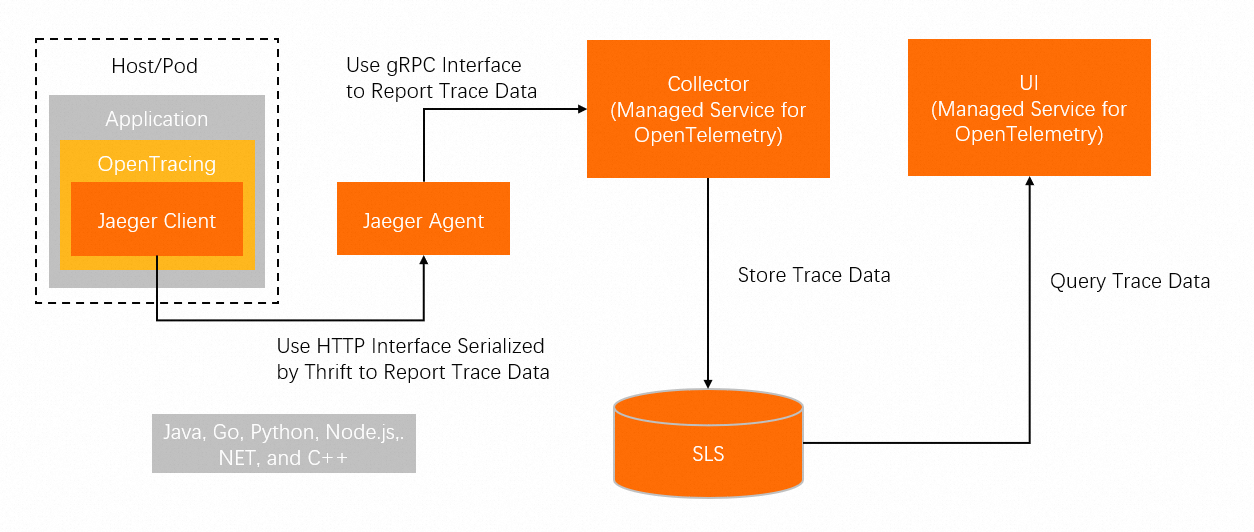
The following figure shows how to report data by using the Jaeger agent.
Method 1: Use Jaeger SDK to report Go application data
In this example, a Go module is used to manage dependencies. You can use Jaeger SDK to instrument your application and report your application data to Tracing Analysis. If you use other tools to manage dependencies, perform operations based on your actual requirements.
Import jaeger-client-go.
go get github.com/uber/jaeger-client-goCreate a Tracer object.
NoteReplace
<endpoint>with the endpoint for Jaeger in the corresponding region on the Access point information page of the Tracing Analysis console. For more information about how to obtain the endpoint, see the Prerequisites section in this topic.func NewJaegerTracer(service string) (opentracing.Tracer, io.Closer) { sender := transport.NewHTTPTransport( // Specify the endpoint. The endpoint differs in different regions. "<endpoint>", ) tracer, closer:= jaeger.NewTracer(service, jaeger.NewConstSampler(true), jaeger.NewRemoteReporter(sender)) return tracer, closer }Create a span and pass data.
If no parent span is available, use the following code:
// Create a span.
span := tracer.StartSpan("myspan")
// Set a tag.
clientSpan.SetTag("mytag", "123")
// Pass the ID of the trace.
tracer.Inject(span.Context(), opentracing.HTTPHeaders, opentracing.HTTPHeadersCarrier(req.Header))
...
defer  span.Finish()
If a parent span is available, use the following code:
// Extract a SpanContext from an HTTP request or an RPC request.
spanCtx, _ := tracer.Extract(opentracing.HTTPHeaders, opentracing.HTTPHeadersCarrier(r.Header))
span := tracer.StartSpan("myspan", opentracing.ChildOf(spanCtx))
...
defer  span.Finish()
For more information, see Jaeger Bindings for Go OpenTracing API.
Method 2: Use the Jaeger agent to report Go application data
Start the Jaeger agent. For more information, see Install the Jaeger agent.
Import jaeger-client-go.
go get github.com/uber/jaeger-client-goCreate a Tracer object.
func NewJaegerTracer(serviceName string) (opentracing.Tracer, io.Closer) {
   sender, _ := jaeger.NewUDPTransport("",0)
   tracer, closer:= jaeger.NewTracer(serviceName,
        jaeger.NewConstSampler(true),
        jaeger.NewRemoteReporter(sender))
    return tracer, closer
}
Create a span and pass data.
If no parent span is available, use the following code:
// Create a span.
span := tracer.StartSpan("myspan")
// Set a tag.
clientSpan.SetTag("mytag", "123")
// Pass the ID of the trace.
tracer.Inject(span.Context(), opentracing.HTTPHeaders, opentracing.HTTPHeadersCarrier(req.Header))
...
defer  span.Finish()
If a parent span is available, use the following code:
// Extract a SpanContext from an HTTP request or an RPC request.
spanCtx, _ := tracer.Extract(opentracing.HTTPHeaders, opentracing.HTTPHeadersCarrier(r.Header))
span := tracer.StartSpan("myspan", opentracing.ChildOf(spanCtx))
...
defer  span.Finish()
For more information, see Jaeger Bindings for Go OpenTracing API.
Examples
Use Jaeger SDK to report Go application data
Obtain the required endpoint. For more information, see the Prerequisites section in this topic.
Run the following command to download the demo:
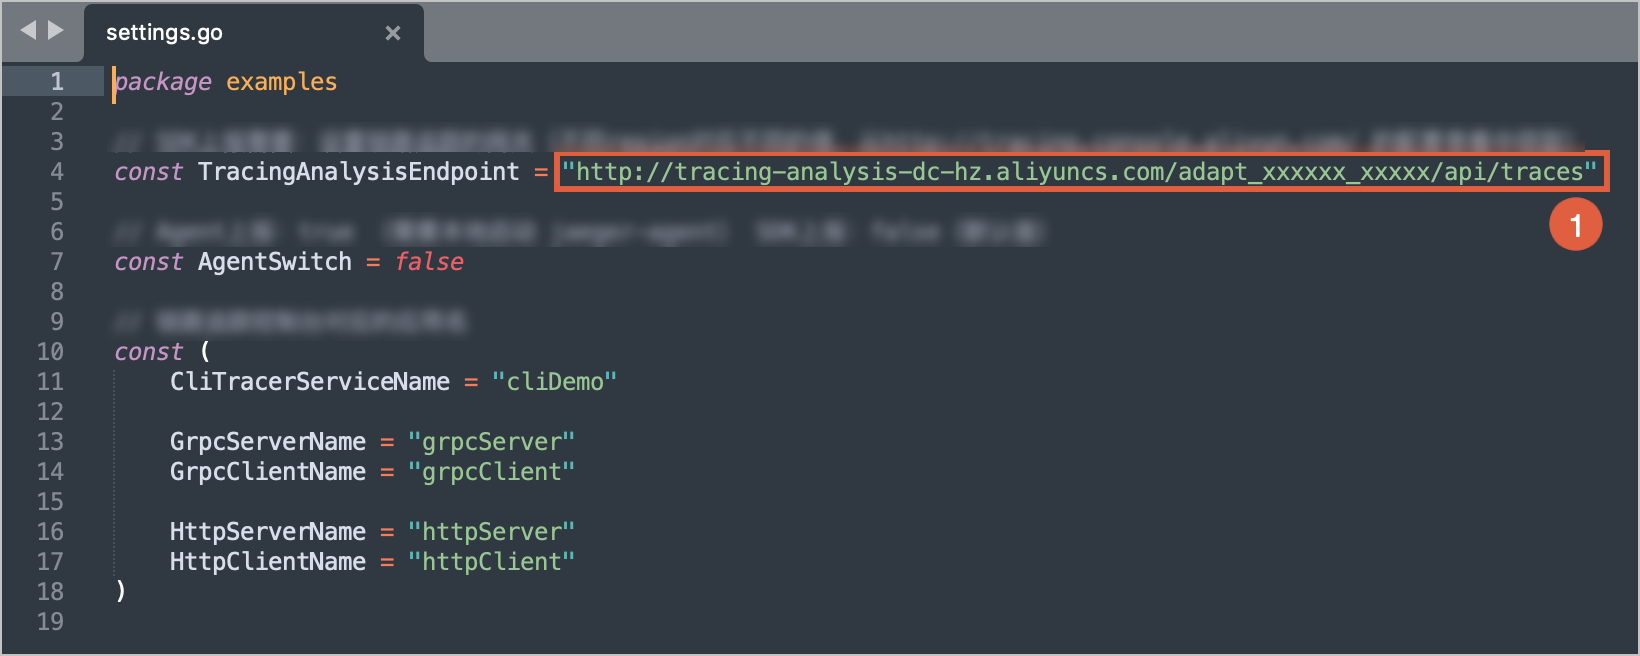
wget https://arms-apm-cn-hangzhou.oss-cn-hangzhou.aliyuncs.com/demo/tracing-demo.zip && unzip tracing-demo.zipDecompress the ZIP package, open the examples/settings.go file in the demo, and then set the TracingAnalysisEndpoint parameter to the endpoint obtained in Step 1, as shown in the following figure.
Run the
go mod tidycommand to clean up the unused dependencies.Run the
go run tracingdemocommand to run the demo.
Use the Jaeger agent to report Go application data
Obtain the required endpoint. For more information, see the Prerequisites section in this topic.
Run the following command to download the demo:
wget https://arms-apm-cn-hangzhou.oss-cn-hangzhou.aliyuncs.com/demo/tracing-demo.zip && unzip tracing-demo.zipStart the Jaeger agent. For more information, see Install the Jaeger agent.
Open the examples/settings.go file in the demo and set the
AgentSwitchparameter totrue.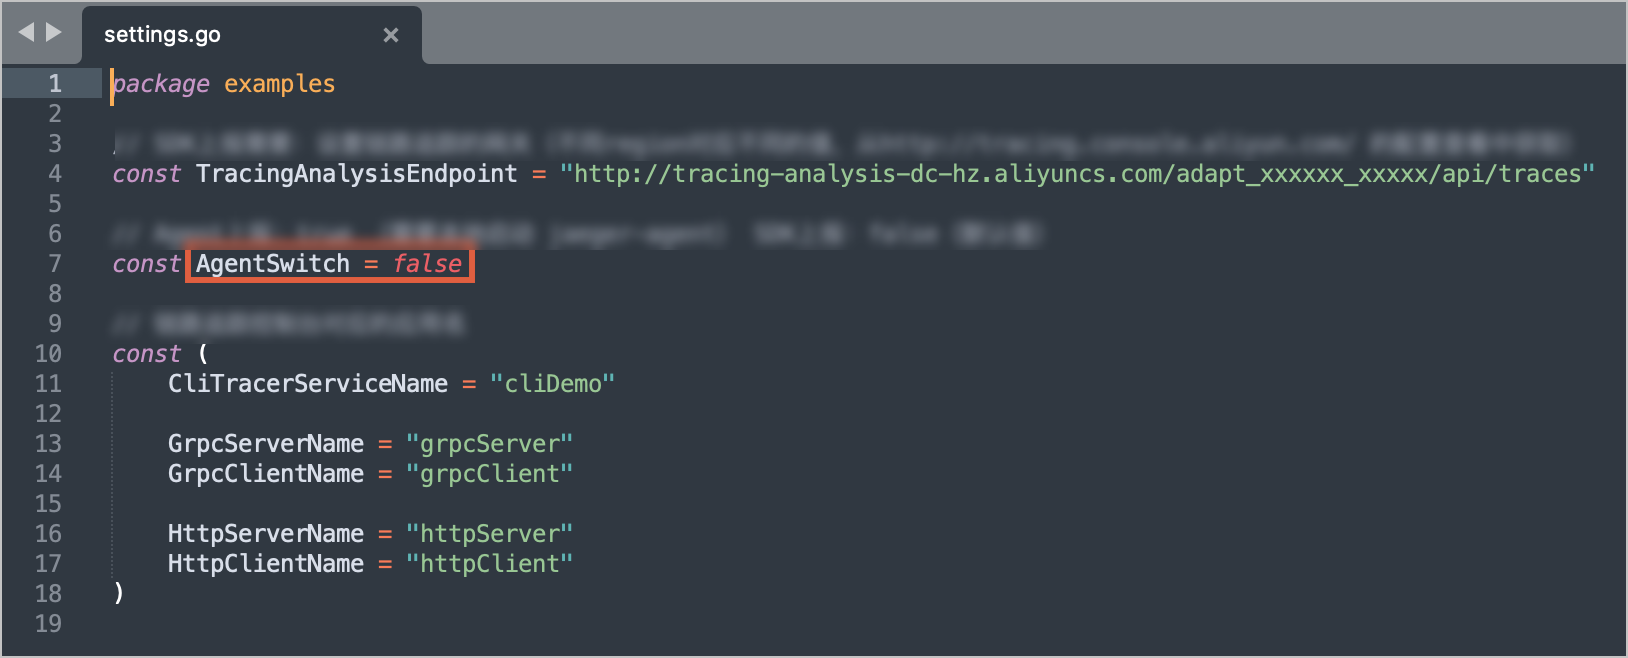
Run the
go mod tidycommand to clean up the unused dependencies.Run the
go run tracingdemocommand to run the demo.
FAQ
Q: Why does the following error occur when I use Jaeger to report Go application data?
2021/06/28 21:11:54 ERROR: error when flushing the buffer: error from collector: 403A: This is because the specified endpoint is invalid. Specify a valid endpoint and try again.