After you use OpenTelemetry to instrument an application and report the trace data to Managed Service for OpenTelemetry, Managed Service for OpenTelemetry starts to monitor the application. You can view the monitoring data of the application such as application topology, traces, abnormal transactions, slow transactions, and SQL analysis. This topic describes how to use OpenTelemetry SDK for PHP to automatically or manually instrument a PHP application and report the trace data of the PHP application.
Prerequisites
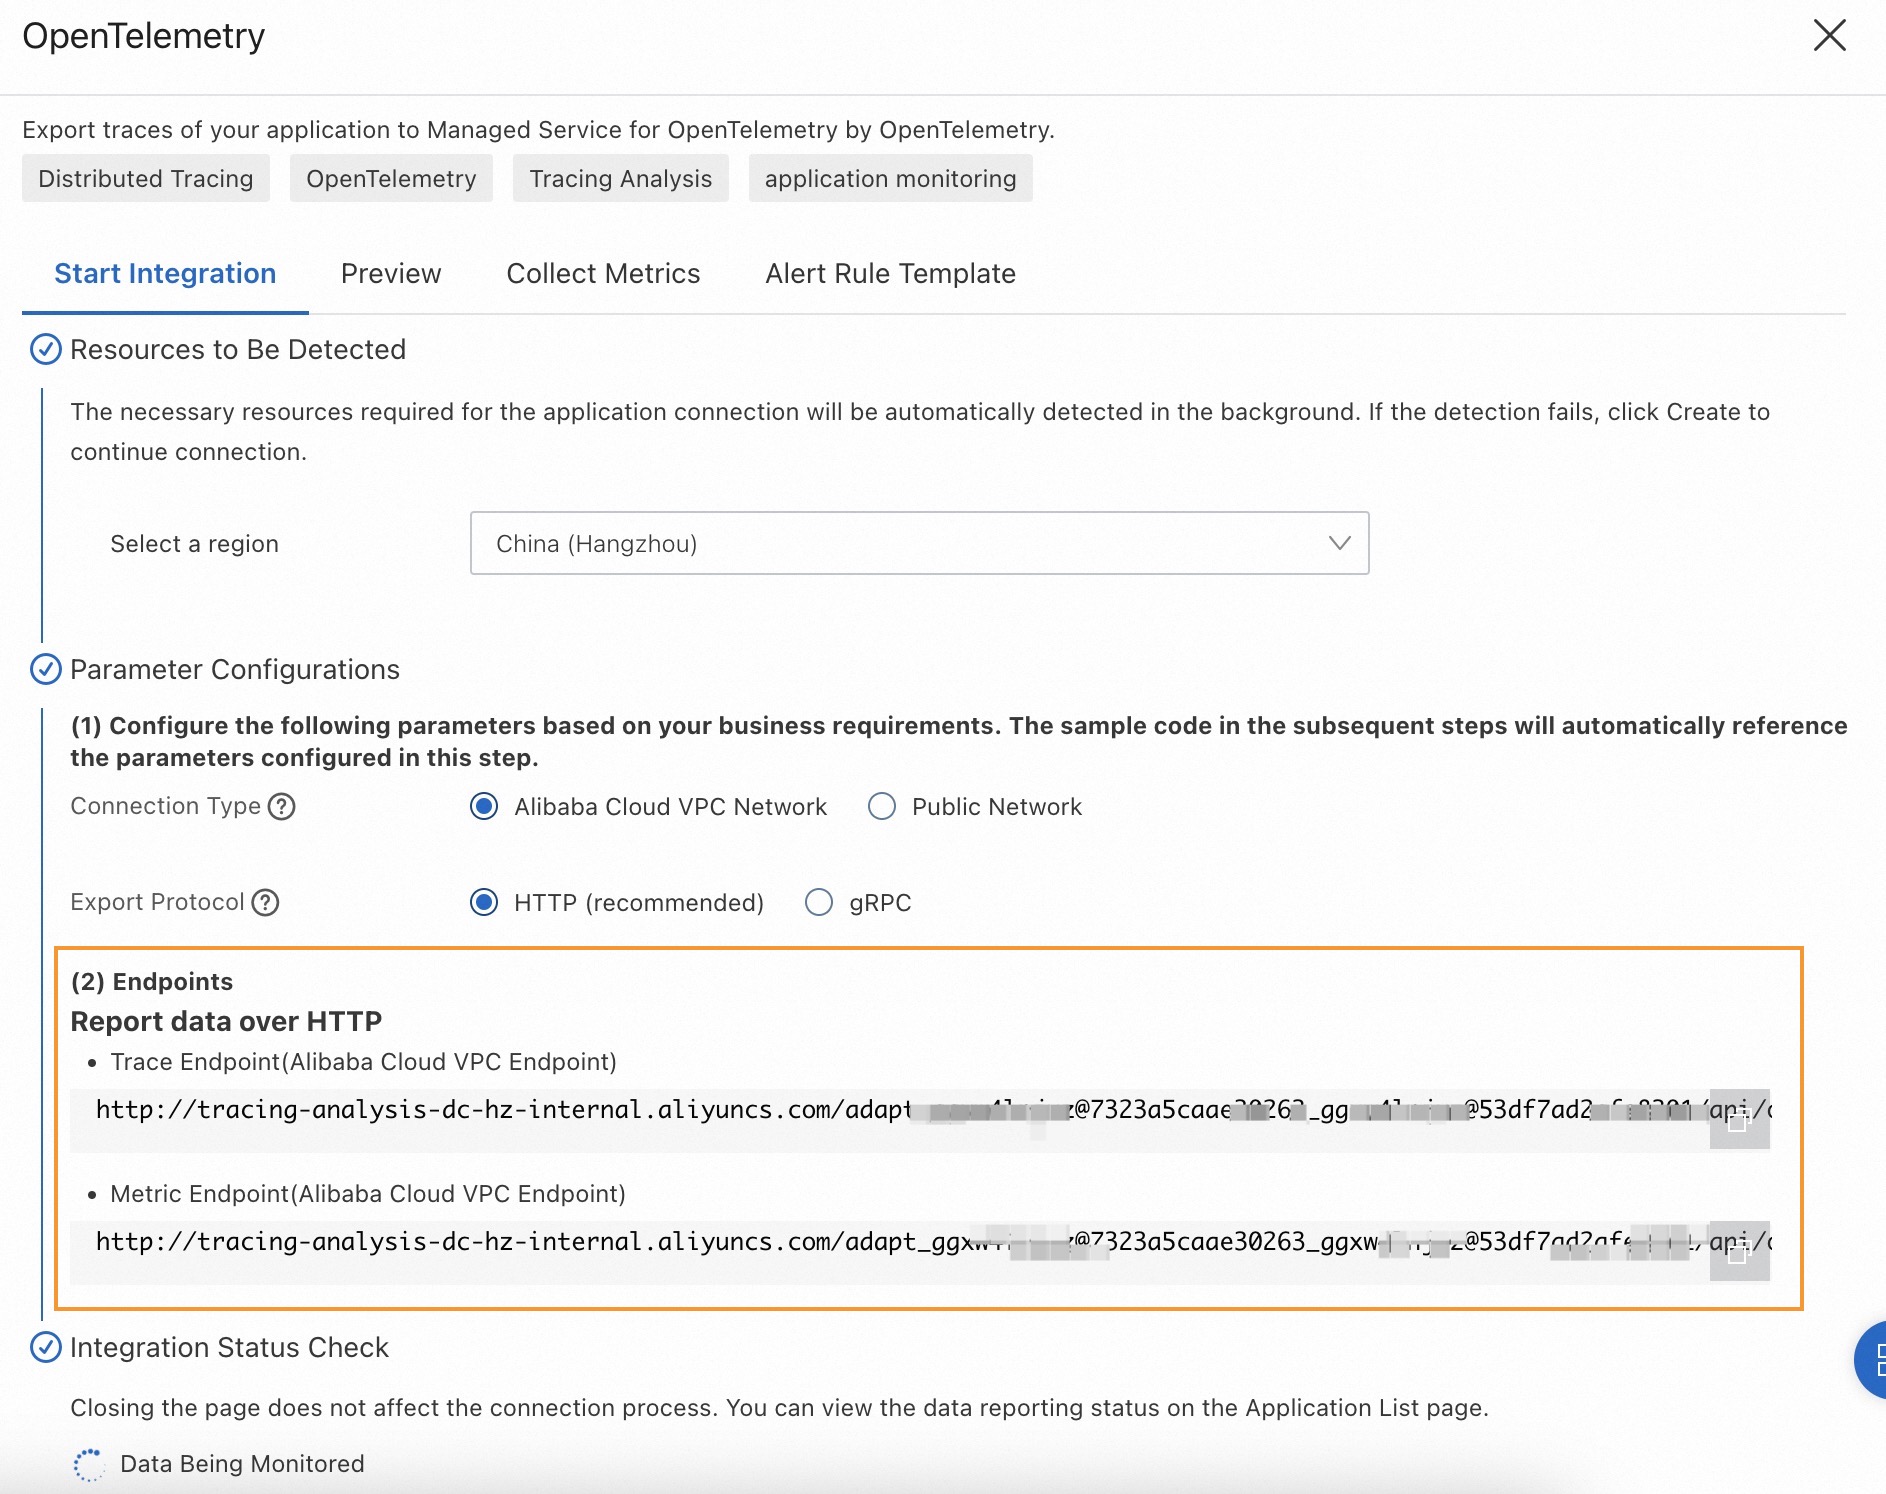
Log on to the Application Real-Time Monitoring Service (ARMS) console. In the left-side navigation pane, click Integration Center.
On the Integration Center page, click the OpenTelemetry card in the Server-side Applications section.
In the OpenTelemetry panel, click the Start Integration tab, and then select a region in which you want to report data.
NoteWhen you access a region for the first time, resources are automatically initialized there.
Configure the Connection Type and Export Protocol parameters and copy an endpoint.
Connection Type: If your service is deployed on Alibaba Cloud and resides in the region that you selected, we recommend that you set this parameter to Alibaba Cloud VPC Network. Otherwise, set this parameter to Public Network.
Export Protocol: Set this parameter to HTTP (recommended) or gRPC based on the protocol that is supported by the client.
Background information
OpenTelemetry SDK for PHP allows you to automatically or manually instrument a PHP application by using different versions of PHP.
To automatically instrument a PHP application, use PHP 8.0 or later.
To manually instrument a PHP application, use PHP 7.4 or later.
OpenTelemetry SDK for PHP supports automatic instrumentation based on multiple frameworks. For more information, see Registry.
Sample code
Download the sample code from php-demo.
Use the OpenTelemetry PHP extension to automatically instrument an application and report trace data
This section describes how to create a PHP application that simulates dice rolling based on the Slim framework. This section also describes how to use OpenTelemetry to automatically instrument the application to report the trace data of the application in a non-intrusive manner. During this process, OpenTelemetry automatically generates trace data and span data.
OpenTelemetry supports automatic instrumentation based on multiple frameworks, including Slim. For more information, see Registry.
Prerequisites
PHP 8.0 or later, Composer, and PHP Extension Community Library (PECL) are installed.
Procedure
Create a dice-rolling application.
Initialize the application.
mkdir <project-name> && cd <project-name>


composer init \
 --no-interaction \
 --stability beta \
 --require slim/slim:"^4" \
 --require slim/psr7:"^1"
composer update
Write the application code.
Create an index.php file in the <project-name> folder and add the following code.
The following sample code simulates a dice-rolling game that rolls a dice and returns a random number in the range of one to six:
<?php
use Psr\Http\Message\ResponseInterface as Response;
use Psr\Http\Message\ServerRequestInterface as Request;
use Slim\Factory\AppFactory;

require __DIR__ . '/vendor/autoload.php';

$app = AppFactory::create();

$app->get('/rolldice', function (Request $request, Response $response) {
 $result = random_int(1,6);
 $response->getBody()->write(strval($result));
 return $response;
});

$app->run();
After you write the application code, run the
php -S localhost:8080command to run the application. Visithttp://localhost:8080/rolldicein a browser.
Build the OpenTelemetry PHP extension.
Download the tools that are required to build the OpenTelemetry PHP extension.
macOS
brew install gcc make autoconfLinux (apt command)
sudo apt-get install gcc make autoconf
Use PECL to build the OpenTelemetry PHP extension.
pecl install opentelemetryThe last few lines of a sample success response are similar to the following output:
Build process completed successfully
Installing '/opt/homebrew/Cellar/php/8.2.8/pecl/20220829/opentelemetry.so'
install ok: channel://pecl.php.net/opentelemetry-1.0.0beta6
Extension opentelemetry enabled in php.ini
Optional. Enable the OpenTelemetry PHP extension.
If the
Extension opentelemetry enabled in php.inimessage is returned in the previous step, skip this step.Add the following code to the php.ini file:
[opentelemetry]
extension=opentelemetry.so
Verify whether the OpenTelemetry PHP extension is built and enabled.
Method 1:
php -m | grep opentelemetryExpected output:
opentelemetryMethod 2
php --ri opentelemetryExpected output:
opentelemetry
opentelemetry support => enabled
extension version => 1.0.0beta6
Add additional dependencies required for OpenTelemetry SDK for PHP to perform automatic instrumentation on the dice-rolling application.
# This operation takes an extended period of time. A large amount of information is displayed in the console.
pecl install grpc


composer config allow-plugins.php-http/discovery false
composer require \
  open-telemetry/sdk \
  open-telemetry/opentelemetry-auto-slim \
  open-telemetry/exporter-otlp \
  php-http/guzzle7-adapter \
  open-telemetry/transport-grpc
open-telemetry/sdk: the package of OpenTelemetry SDK for PHP.
open-telemetry/opentelemetry-auto-slim: the automatic instrumentation plug-in of OpenTelemetry SDK for PHP based on the Slim framework.
open-telemetry/exporter-otlp: the dependencies required for OpenTelemetry SDK for PHP to report data over OpenTelemetry Protocol (OTLP).
Run the application.
Run the following commands:
env OTEL_PHP_AUTOLOAD_ENABLED=true \
 OTEL_SERVICE_NAME=<your-service-name> \
 OTEL_TRACES_EXPORTER=otlp \
 OTEL_METRICS_EXPORTER=none \
 OTEL_LOGS_EXPORTER=none \
 OTEL_EXPORTER_OTLP_PROTOCOL=grpc \
 OTEL_EXPORTER_OTLP_ENDPOINT=<endpoint> \
 OTEL_EXPORTER_OTLP_HEADERS=Authentication=<token> \
 OTEL_PROPAGATORS=baggage,tracecontext \
 php -S localhost:8080
<your-service-name>: the name of your application. Example:
php-demo.<endpoint>: the gRPC endpoint that you have obtained in the Prerequisites section. Example:
http://tracing-analysis-dc-hz.aliyuncs.com:8090.<token>: the authentication token that you have obtained in the Prerequisites section.
Visit the following URL in a browser:
http://localhost:8080/rolldiceEach time you access this page, OpenTelemetry automatically generates trace data and reports the trace data to Managed Service for OpenTelemetry.
View the trace data.
Log on to the Managed Service for OpenTelemetry console. On the Applications page, find the application and click its name. On the application details page, view the trace data of the application.
Use OpenTelemery SDK for PHP to manually instrument an application and report trace data
This section describes how to create a PHP application that simulates dice rolling based on the Slim framework. This section also describes how to use OpenTelemetry SDK for PHP to manually instrument the application to report the trace data of the application based on custom settings. During this process, you can create a span in the code and configure the attributes, events, and status for the span.
If automatic instrumentation cannot meet your business requirements or you want to manually add instrumentation based on your business requirements, you can manually instrument an application to report data.
Prerequisites
PHP 7.4 or later, Composer, and PECL are installed.
Procedure
Create a dice-rolling application.
Initialize the application.
mkdir <project-name> && cd <project-name>


composer init \
 --no-interaction \
 --stability beta \
 --require slim/slim:"^4" \
 --require slim/psr7:"^1"
composer update
Write the application code.
Create an index.php file in the <project-name> folder and add the following code.
The following sample code simulates a dice-rolling game that rolls a dice and returns a random number in the range of one to six:
<?php
use Psr\Http\Message\ResponseInterface as Response;
use Psr\Http\Message\ServerRequestInterface as Request;
use Slim\Factory\AppFactory;

require __DIR__ . '/vendor/autoload.php';

$app = AppFactory::create();

$app->get('/rolldice', function (Request $request, Response $response) {
 $result = random_int(1,6);
 $response->getBody()->write(strval($result));
 return $response;
});

$app->run();
After you write the application code, run the
php -S localhost:8080command to run the application. Visithttp://localhost:8080/rolldicein a browser.
Add the dependencies of OpenTelemetry SDK for PHP.
gRPC
Download the PHP HTTP client library for reporting trace data.
composer require guzzlehttp/guzzleDownload the package of OpenTelemetry SDK for PHP.
composer require \
 open-telemetry/sdk \
 open-telemetry/exporter-otlp
Download the dependencies that are required to report data over gRPC.
pecl install grpc # If gRPC is already downloaded and installed, skip this step.
composer require open-telemetry/transport-grpc
HTTP
Download the PHP HTTP client library for reporting trace data.
composer require guzzlehttp/guzzleDownload the package of OpenTelemetry SDK for PHP.
composer require \
 open-telemetry/sdk \
 open-telemetry/exporter-otlp
Write the OpenTelemetry initialization code.
Create an opentelemetry_util.php file in the same directory as the index.php file.
Add the following code to the opentelemetry_util.php file:
gRPC
<?php
use OpenTelemetry\API\Common\Instrumentation\Globals;
use OpenTelemetry\API\Trace\Propagation\TraceContextPropagator;
use OpenTelemetry\Contrib\Otlp\SpanExporter;
use OpenTelemetry\SDK\Common\Attribute\Attributes;
use OpenTelemetry\SDK\Common\Export\Stream\StreamTransportFactory;
use OpenTelemetry\SDK\Resource\ResourceInfo;
use OpenTelemetry\SDK\Resource\ResourceInfoFactory;
use OpenTelemetry\SDK\Sdk;
use OpenTelemetry\SDK\Trace\Sampler\AlwaysOnSampler;
use OpenTelemetry\SDK\Trace\Sampler\ParentBased;
use OpenTelemetry\SDK\Trace\SpanProcessor\SimpleSpanProcessor;
use OpenTelemetry\SDK\Trace\SpanProcessor\BatchSpanProcessorBuilder;
use OpenTelemetry\SDK\Trace\TracerProvider;
use OpenTelemetry\SemConv\ResourceAttributes;
use OpenTelemetry\Contrib\Grpc\GrpcTransportFactory;
use OpenTelemetry\Contrib\Otlp\OtlpUtil;
use OpenTelemetry\API\Signals;
// Initialize OpenTelemetry during the initialization of the PHP application.
function initOpenTelemetry()
{
    // 1. Specify the information about OpenTelemetry resources.
    $resource = ResourceInfoFactory::emptyResource()->merge(ResourceInfo::create(Attributes::create([
        ResourceAttributes::SERVICE_NAME => '<your-service-name>', # Required. The name of your application.
        ResourceAttributes::HOST_NAME => '<your-host-name>' # Optional. The hostname.
    ])));

    // 2. Create a SpanExporter that exports span data to the console.
    // $spanExporter = new SpanExporter(
    //     (new StreamTransportFactory())->create('php://stdout', 'application/json')
    // );

    // 2. Create a SpanExporter that reports span data over gRPC.
    $headers = [
        'Authentication' => "<your-token>",
    ];
    $transport = (new GrpcTransportFactory())->create('<grpc-endpoint>' . OtlpUtil::method(Signals::TRACE), 'application/x-protobuf', $headers);
    $spanExporter = new SpanExporter($transport);

    // 3. Add a global TracerProvider to create tracers.
    $tracerProvider = TracerProvider::builder()
        ->addSpanProcessor(
            (new BatchSpanProcessorBuilder($spanExporter))->build()
        )
        ->setResource($resource)
        ->setSampler(new ParentBased(new AlwaysOnSampler()))
        ->build();

    Sdk::builder()
        ->setTracerProvider($tracerProvider)
        ->setPropagator(TraceContextPropagator::getInstance())
        ->setAutoShutdown(true)  // Specifies whether to automatically shut down the TracerProvider when you exit the PHP application. This ensures that all trace data is reported.
        ->buildAndRegisterGlobal(); // Add the TracerProvider globally.
}
?>
<your-service-name>: the name of your application
<your-host-name>: the hostname
<your-token>: the authentication token that is used to report data over gRPC
<grpc-endpoint>: the endpoint that is used to report data over gRPC
HTTP
<?php
use OpenTelemetry\API\Common\Instrumentation\Globals;
use OpenTelemetry\API\Trace\Propagation\TraceContextPropagator;
use OpenTelemetry\Contrib\Otlp\SpanExporter;
use OpenTelemetry\SDK\Common\Attribute\Attributes;
use OpenTelemetry\SDK\Common\Export\Stream\StreamTransportFactory;
use OpenTelemetry\SDK\Resource\ResourceInfo;
use OpenTelemetry\SDK\Resource\ResourceInfoFactory;
use OpenTelemetry\SDK\Sdk;
use OpenTelemetry\SDK\Trace\Sampler\AlwaysOnSampler;
use OpenTelemetry\SDK\Trace\Sampler\ParentBased;
use OpenTelemetry\SDK\Trace\SpanProcessor\SimpleSpanProcessor;
use OpenTelemetry\SDK\Trace\SpanProcessor\BatchSpanProcessorBuilder;
use OpenTelemetry\SDK\Trace\TracerProvider;
use OpenTelemetry\SemConv\ResourceAttributes;
use OpenTelemetry\Contrib\Otlp\OtlpHttpTransportFactory;
use OpenTelemetry\SDK\Common\Export\TransportFactoryInterface;

// Initialize OpenTelemetry during the initialization of the PHP application.
function initOpenTelemetry()
{
    // 1. Specify the information about OpenTelemetry resources.
    $resource = ResourceInfoFactory::emptyResource()->merge(ResourceInfo::create(Attributes::create([
        ResourceAttributes::SERVICE_NAME => '<your-service-name>', # Required. The name of your application.
        ResourceAttributes::HOST_NAME => '<your-host-name>' # Optional. The hostname.
    ])));

    // 2. (Optional) Create a SpanExporter that exports span data to the console.
    // $spanExporter = new SpanExporter(
    //     (new StreamTransportFactory())->create('php://stdout', 'application/json')
    // );


    // 2. Create a SpanExporter that reports span data over HTTP.
    $transport = (new OtlpHttpTransportFactory())->create('<http-endpoint>','application/x-protobuf');
    $spanExporter = new SpanExporter($transport);

    // 3. Add a global TracerProvider to create tracers.
    $tracerProvider = TracerProvider::builder()
        ->addSpanProcessor(
            (new BatchSpanProcessorBuilder($spanExporter))->build()
        )
        ->setResource($resource)
        ->setSampler(new ParentBased(new AlwaysOnSampler()))
        ->build();

    Sdk::builder()
        ->setTracerProvider($tracerProvider)
        ->setPropagator(TraceContextPropagator::getInstance())
        ->setAutoShutdown(true)  // Specifies whether to automatically shut down the TracerProvider when you exit the PHP application. This ensures that all trace data is reported.
        ->buildAndRegisterGlobal(); // Add the TracerProvider globally.
}
?>
<your-service-name>: the name of your application
<your-host-name>: the hostname
<http-endpoint>: the endpoint that is used to report data over HTTP
Modify the application code and use the OpenTelemetry API to create a span.
Import the required packages in the index.php file.
<?php

use OpenTelemetry\API\Common\Instrumentation\Globals;
use OpenTelemetry\SDK\Common\Attribute\Attributes;
use OpenTelemetry\SDK\Trace\TracerProvider;

require __DIR__ . '/opentelemetry_util.php';
Call the initOpenTelemetry method to initialize OpenTelemetry. You must perform this operation during the initialization of the PHP application.
// Initialize OpenTelemetry. Specify the application name, export mode of trace data, and endpoint that is used to report trace data, and create a global TracerProvider.
initOpenTelemetry();
Create a span when you call the rolldice operation.
/**
 * 1. Operation description: simulates a dice-rolling game that rolls a dice and returns a random number in the range of one to six.
 * Create a span, and configure attributes, events, and events with attributes for the span.
 */
$app->get('/rolldice', function (Request $request, Response $response) {
 // Obtain the tracer.
 $tracer = \OpenTelemetry\API\Globals::tracerProvider()->getTracer('my-tracer');
 // Create a span.
 $span = $tracer->spanBuilder("/rolldice")->startSpan();
 // Configure attributes for the span.
 $span->setAttribute("http.method", "GET");
 // Configure events for the span.
 $span->addEvent("Init");
 // Configure events with attributes.
 $eventAttributes = Attributes::create([
 "key1" => "value",
 "key2" => 3.14159,
 ]);

 // The business code.
 $result = random_int(1,6);
 $response->getBody()->write(strval($result));

 $span->addEvent("End");
 // Destroy the span.
 $span->end();

 return $response;
});
Create a nested span.
Create a rolltwodices operation to simulate a dice-rolling game that rolls two dice and returns a random number in the range of one to six.
The following sample code provides an example on how to create a nested span:
$app->get('/rolltwodices', function (Request $request, Response $response) {
 // Obtain the tracer.
 $tracer = \OpenTelemetry\API\Globals::tracerProvider()->getTracer('my-tracer');
 // Create a span.
 $parentSpan = $tracer->spanBuilder("/rolltwodices/parent")->startSpan();
 $scope = $parentSpan->activate();

 $value1 = random_int(1,6);

 $childSpan = $tracer->spanBuilder("/rolltwodices/parent/child")->startSpan();

 // The business code.
 $value2 = random_int(1,6);
 $result = "dice1: " . $value1 . ", dice2: " . $value2;

 // Destroy the span.
 $childSpan->end();
 $parentSpan->end();
 $scope->detach();

 $response->getBody()->write(strval($result));
 return $response;
});
Use a span to record the exceptions that occur in the code.
Create an error operation to simulate a case in which an exception occurs in the operation.
The following sample code provides an example on how to use a span to record the exceptions that occur in the code:
$app->get('/error', function (Request $request, Response $response) {
 // Obtain the tracer.
 $tracer = \OpenTelemetry\API\Globals::tracerProvider()->getTracer('my-tracer');
 // Create a span.
 $span3 = $tracer->spanBuilder("/error")->startSpan();
 try {
 // Simulate a case in which an exception occurs in the code.
 throw new \Exception('exception!');
 } catch (\Throwable $t) {
 // Set the state of the span to error.
 $span3->setStatus(\OpenTelemetry\API\Trace\StatusCode::STATUS_ERROR, "exception in span3!");
 // Record the trace of the stack exception.
 $span3->recordException($t, ['exception.escaped' => true]);
 } finally {
 $span3->end();
 $response->getBody()->write("error");
 return $response;
 }
});
Run the application.
Run the following command:
php -S localhost:8080Visit the following URLs in a browser:
http://localhost:8080/rolldice
http://localhost:8080/rolltwodices
http://localhost:8080/error
Each time you access the page, OpenTelemetry generates trace data and reports the trace data to Managed Service for OpenTelemetry.
View the trace data.
Log on to the Managed Service for OpenTelemetry console. On the Applications page, find the application and click its name. On the application details page, view the trace data of the application.