After you add a ServiceMonitor or PodMonitor to a Prometheus instance in Managed Service for Prometheus, the instance may not collect monitoring data as expected. Use this guide to identify the root cause and resolve the issue.
How ServiceMonitor and PodMonitor work
Understanding the relationship between components helps you pinpoint where the configuration breaks:
Deployment ──> Pod ──> Service ──> ServiceMonitor ──> Prometheus instance
                 │                                         ▲
                 └──────────> PodMonitor ─────────────────┘
A ServiceMonitor selects Kubernetes Services by label, then scrapes the pods behind those Services. The
portfield in the ServiceMonitor must reference the port name defined in the Service spec, not a port number.A PodMonitor selects pods directly by label and scrapes them without requiring a Service.
Both resources must be enabled in the Managed Service for Prometheus console and correctly delivered to your Container Service for Kubernetes (ACK) cluster.
Step 1: Check whether the target is detected
Log on to the ARMS console.
In the left-side navigation pane, choose Managed Service for Prometheus > Instances.
Click the name of the Prometheus instance. In the left-side navigation pane, click Service Discovery.
On the Service Discovery page, click the Targets tab and check whether the target appears.
Based on the result, go to the corresponding section:
| Result | Next step |
|---|---|
| Target is not listed | Target not detected |
| Target is listed in red | Target detected with errors |
| Target status is UP but no data is collected | Target is UP but no monitoring data |
Target not detected
If the target does not appear on the Targets tab, work through the following checks in order.
Check 1: Verify that ServiceMonitor or PodMonitor is enabled
On the Service Discovery page, click the Configurations tab.
Click the ServiceMonitor or PodMonitor tab.
Confirm that the resource is enabled, as shown by the toggle icon.
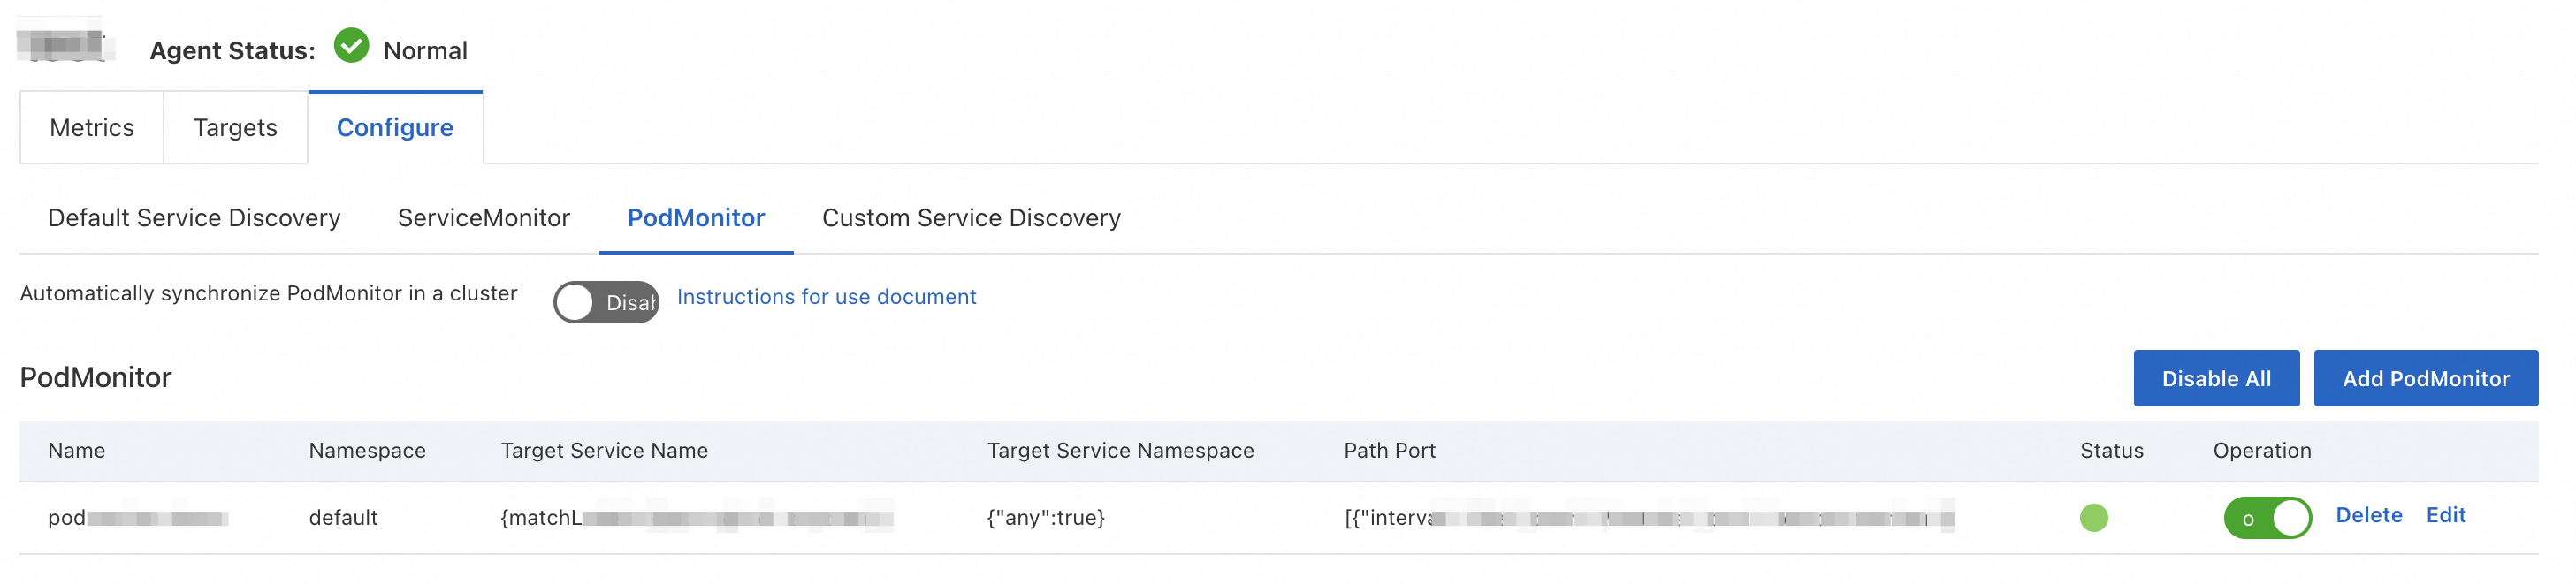
If the resource is disabled, enable it in the Actions column and wait a few minutes for the configuration to propagate.
Check 2: Verify that the resource is delivered to the ACK cluster
Even when a ServiceMonitor or PodMonitor is enabled in the ARMS console, it must be delivered as a Custom Resource Definition (CRD) resource to your ACK cluster.
Log on to the ACK console.
In the left-side navigation pane, click Clusters. Find and click the name of the target cluster.
In the left-side navigation pane, choose .
Click the CRDs tab. In the Name column, click ServiceMonitor or PodMonitor to open the Resource Objects tab.
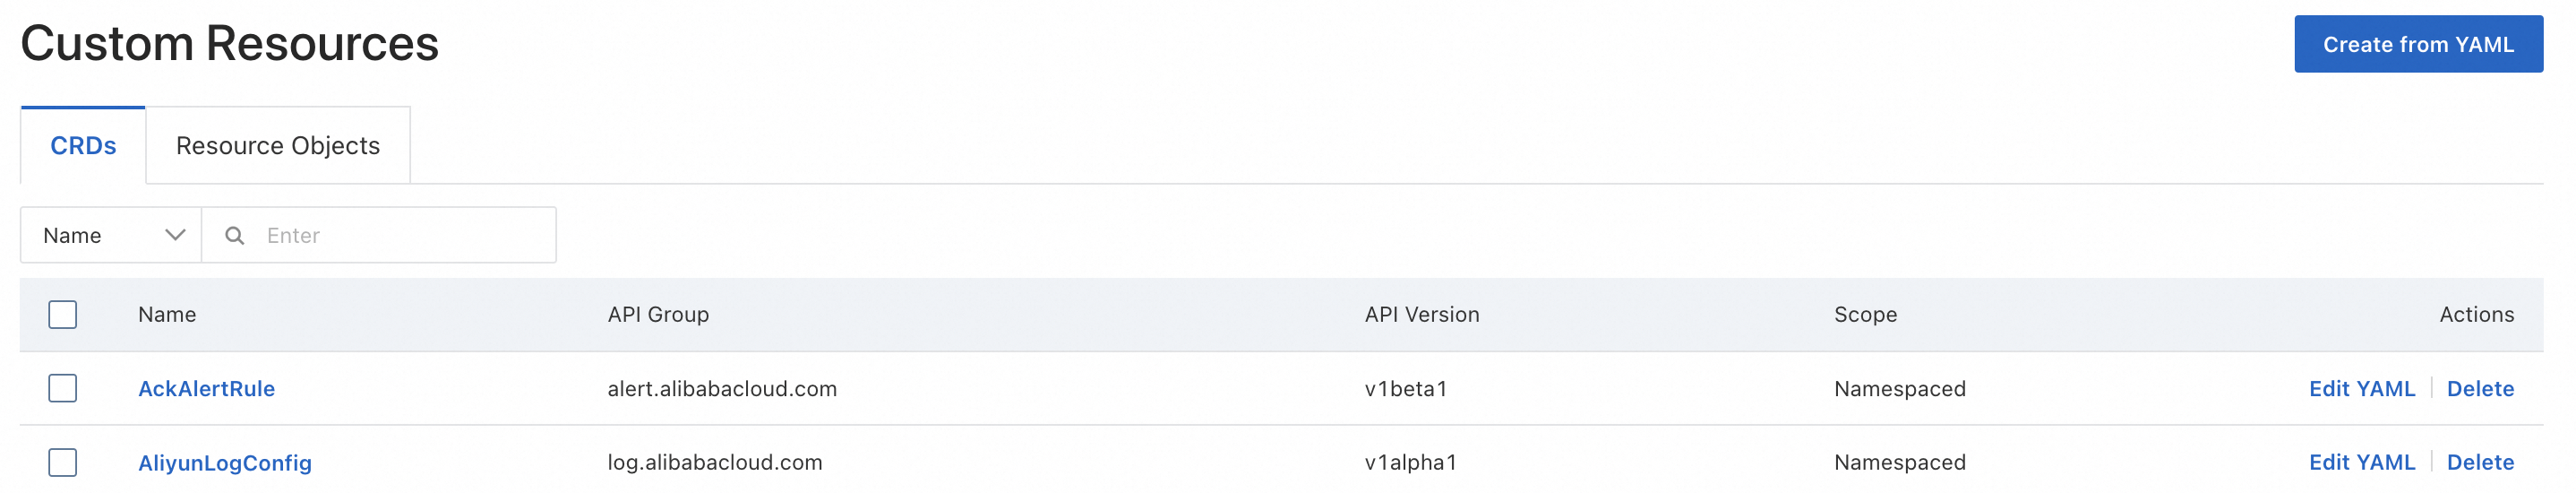
Select the correct namespace and check whether the resource appears in the list.
Not in the list: Go back to the ARMS console and re-enable the resource on the Configurations tab of the Service Discovery page.
In the list: Proceed to Check 3.
Check 3: Verify the label selector
The label selector in your ServiceMonitor or PodMonitor must match the labels on the target Services or pods. If the selector does not match, no targets are discovered.
Run one of the following commands to test whether your label selector returns results:
# If the namespace selector has "any" set to "true" (all namespaces)
kubectl get pod/service -l label_key=label_value -A

# If a specific namespace is configured
kubectl get pod/service -l label_key=label_value -n <namespace>
Replace label_key=label_value with the actual key-value pair from your spec.selector.matchLabels field. Replace <namespace> with the target namespace.
If no results are returned, update the label selector or namespace selector to match the target pods or Services.
Check 4: Verify the port configuration
The port field in a ServiceMonitor or PodMonitor must reference a port name, not a port number.
| Resource type | port value must match |
|---|---|
| ServiceMonitor | spec.ports[].name in the corresponding Service definition |
| PodMonitor | spec.containers[].ports[].name in the corresponding Pod definition |
Correct example:
# Service definition
apiVersion: v1
kind: Service
metadata:
  name: my-app
spec:
  ports:
  - name: web        # Port name defined here
    port: 8080

---
# ServiceMonitor definition
apiVersion: monitoring.coreos.com/v1
kind: ServiceMonitor
metadata:
  name: my-app-monitor
spec:
  selector:
    matchLabels:
      app: my-app
  endpoints:
  - port: web        # References the port name, not "8080"
Incorrect example:
# This does NOT work - port number instead of port name
endpoints:
- port: "8080"      # Error: spec.endpoints.port in body must be of type string
Target detected with errors
Target is UP but no monitoring data
See also
-- Manually configure ServiceMonitor or PodMonitor.
Configure metrics -- View and manage metrics collected through service discovery.
-- Billing for collected metrics.
-- Billing details for earlier pricing models.