Third-party systems such as Grafana, Istio, and Horizontal Pod Autoscaler (HPA) need a Prometheus-compatible endpoint to query metrics. Managed Service for Prometheus exposes an HTTP API address for each Prometheus instance that serves as this endpoint. Retrieve the address from the ARMS console and configure it as the data source in the target system.
Prerequisites
Before you begin, make sure that you have:
A Prometheus instance created in Application Real-Time Monitoring Service (ARMS)
Access to the ARMS console
Retrieve the HTTP API address
Log on to the ARMS console.
In the left-side navigation pane, choose Prometheus Service > Prometheus Instances.
Find your Prometheus instance and click Settings in the Actions column.
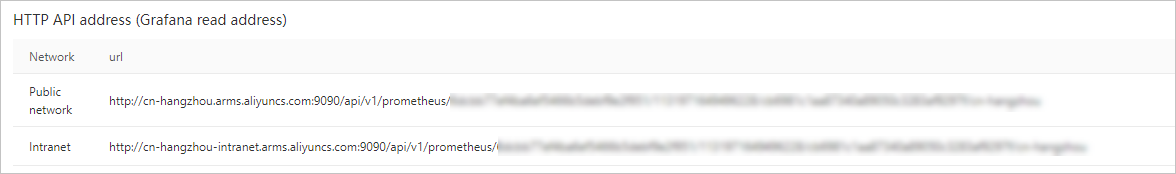
On the Settings tab, copy the HTTP API address that matches your access mode (public or private).
For a Prometheus instance for cloud services, copy the HTTP API address that corresponds to the specific cloud service.
Generate an authentication token (optional)
An authentication token secures the connection between the Prometheus instance and Grafana. After you generate a token, you must specify the token when you add the Prometheus instance to your Grafana system as a data source. Without the token, monitoring data cannot be read from Managed Service for Prometheus.
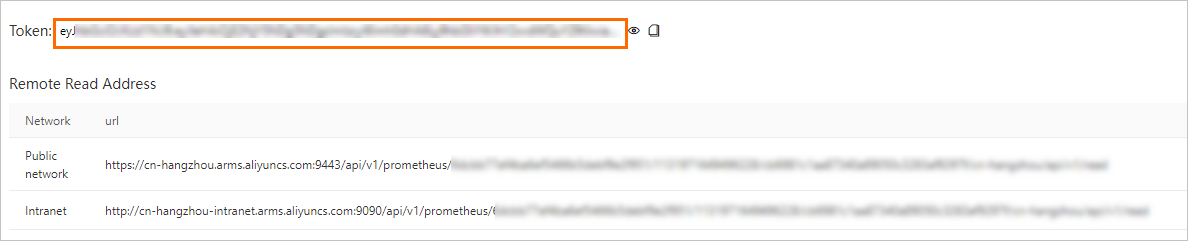
On the Settings tab, click Generate Token in the upper part of the tab.
Copy and save the token.
Configure the third-party system
After you retrieve the HTTP API address and (optionally) an authentication token, add them to the target system.
For detailed steps on integrating with Grafana, see Import data from Managed Service for Prometheus to a local Grafana system.