Enterprises with multiple Alibaba Cloud accounts often need a single place to monitor Prometheus metrics, view Grafana dashboards, and manage alert rules across all accounts. Managed Service for Prometheus provides global aggregation instances for this purpose -- a unified query layer that reads metrics directly from Prometheus instances in other accounts without copying or synchronizing data.
How it works
A global aggregation instance connects one monitoring account to one or more source accounts:
Monitoring account (Account A in this guide): The account that owns the global aggregation instance. Use this account to query metrics, view dashboards, and configure alert rules across all connected Prometheus instances.
Source account (Account B in this guide): Any account whose Prometheus instances are added to the global aggregation instance. The monitoring account reads metrics from these instances but does not store them.
Two authentication methods are available:
| Method | When to use | Setup effort |
|---|---|---|
| Resource directory | Your enterprise already uses an Alibaba Cloud resource directory to manage a multi-account hierarchy | Lower -- the resource directory handles trust relationships automatically |
| RAM role (custom authentication) | Your accounts are not in a resource directory, or you need fine-grained access control | Higher -- requires manual IAM configuration on each source account |
Limitations
Global aggregation instances cannot span super regions. The super regions are Asia Pacific China, Asia Pacific China HMT, Asia Pacific Others, Middle East, Europe, North America, and South America.
Managed Service for Prometheus V2 instances do not support cross-account features.
Prerequisites
Before you begin, make sure that you have:
Two Alibaba Cloud accounts (referred to as Account A and Account B in this guide), both with Managed Service for Prometheus activated
At least one Prometheus instance created under each account. For more information, see Use the integration center to integrate data
Setup overview
Choose an authentication method (resource directory or RAM role) and configure trust between accounts.
Create a global aggregation instance on the monitoring account and select the source Prometheus instances to aggregate.
Query aggregated metrics and configure alert rules from the monitoring account.
Step 1: Create a global aggregation instance
Method 1: Resource directory
Use this method if your enterprise manages accounts through an Alibaba Cloud resource directory.
1a. Set up a delegated administrator
The monitoring account (Account A) must be registered as a delegated administrator for the Prometheus trusted service. Choose one of the following approaches:
Option 1: Use the Resource Management console
Log on to the Resource Management console with the management account of your resource directory.
In the left-side navigation pane, choose Resource Directory > Trusted Services.
Find the Prometheus trusted service and click Manage in the Actions column.
In the Delegated Administrator Accounts section, click Add.
Select Account A as the delegated administrator and click OK.
After configuration, you can use the delegated administrator account to access the multi-account management module of the trusted service and perform administrative operations within the resource directory.
Option 2: Call the RegisterDelegatedAdministrator API
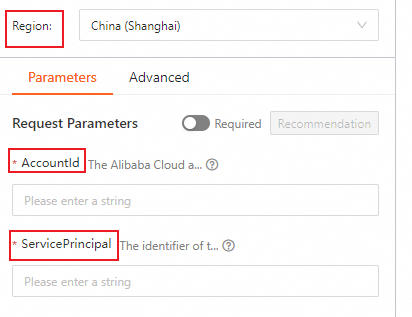
Use the management account of your resource directory (or a RAM role with administrator permissions) to call the RegisterDelegatedAdministrator operation in OpenAPI Explorer with the following parameters:
| Parameter | Value |
|---|---|
| Region | Chinese mainland: select China (Shanghai). Other regions: select Singapore |
| AccountId | The ID of Account A |
| ServicePrincipal | prometheus.aliyuncs.com |
Click Initiate Call to run the request.
1b. Create the instance and aggregate data
Log on to the ARMS console with Account A.
In the left-side navigation pane, choose Managed Service for Prometheus > Instances.
Click Create Prometheus Instance.
On the Create Instance page, configure the following parameters and click Create:
Parameter Description Instance Type Select Global Aggregation Instance Instance Name Enter a name for the global aggregation instance Resource Group Select a resource group Tags (Optional) Add up to 20 case-sensitive key-value tags Endpoint Select the region for alert rule processing. Choose the region with the most Prometheus instances; otherwise, the request duration and system stability may be affected Select the instances to be aggregated Select Other Accounts (Resource Directory). Specify the Resource Directory Member Account and select the Prometheus instances from Account B
After you select Account B, Managed Service for Prometheus automatically enables the trusted service in the resource directory. To aggregate instances across regions, set the Endpoint to the target region first.
Do not change the Endpoint region after creating the instance. Changing the region invalidates all alert rules configured in the original region.
Method 2: RAM role (custom authentication)
Use this method when your accounts are not in a resource directory, or when you need fine-grained access control through IAM policies.
2a. Create a RAM role on the source account (Account B)
Log on to the RAM console with Account B.
In the left-side navigation pane, choose Identities > Roles.
Click Create Role.
Set Principal Type to Cloud Account and click OK.
In the Configure Role step, set the following fields:
RAM Role Name:
AliyunPrometheusQueryRoleSelect Trusted Alibaba Cloud Account: Select Other Alibaba Cloud Account and enter the ID of Account A.
Click OK.
Open the newly created role. On the Trust Policy tab, click Edit Trust Policy and update the policy to grant Account A permissions.

To grant access to multiple monitoring accounts, add their account IDs as an array in the trust policy.
2b. Attach policies to the RAM role
In the left-side navigation pane, choose Identities > Roles.
Find
AliyunPrometheusQueryRoleand click Grant Permission in the Actions column.Search for and select the following policies, then click Grant permissions:
AliyunRAMReadOnlyAccessAliyunARMSReadOnlyAccess
2c. (Optional) Create a RAM user on the monitoring account (Account A)
Skip this step if you already have a RAM user on Account A that will perform the aggregation.
Log on to the RAM console with Account A.
In the left-side navigation pane, choose Identities > Users.
Click Create User and configure the following fields:
Field Description Logon Name Up to 64 characters. Supports letters, digits, periods (.), hyphens (-), and underscores (_) Display Name Up to 128 characters Access Mode Select Console Access for human users, or Using permanent AccessKey to access for programmatic access. For security, assign only one access mode per user 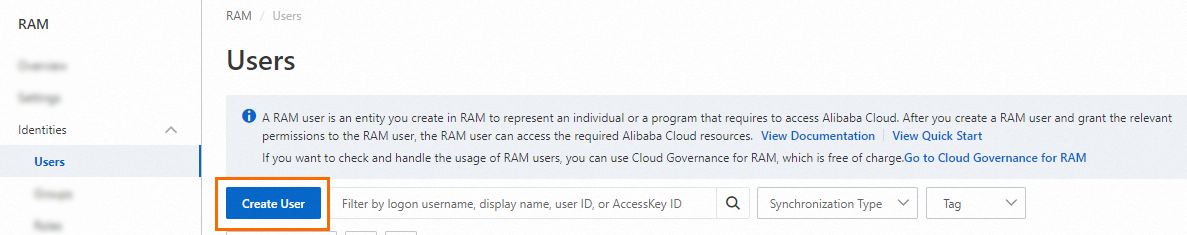
You can click Add User to create multiple RAM users at a time.
If you select Console Access, configure the following options:
Set Console Password: Select Automatically Regenerate Default Password or Reset Custom Password. If you select Reset Custom Password, you must specify a password that meets the complexity requirements. For more information, see Configure a password policy for RAM users.
Password Reset: Specifies whether the RAM user must reset the password upon the next logon.
Enable MFA: Specifies whether to enable multi-factor authentication (MFA) for the RAM user. After you enable MFA, you must bind an MFA device to the RAM user. For more information, see Bind an MFA device to a RAM user.
If you select Using permanent AccessKey to access, the system automatically generates an AccessKey ID and AccessKey secret for the RAM user. For more information, see Obtain an AccessKey pair.
Click OK and complete security verification.
The AccessKey secret is displayed only at creation time. Save it immediately -- it cannot be retrieved later. For production workloads, use Security Token Service (STS) tokens instead of permanent AccessKey pairs. For more information, see Best practices for access credentials.
2d. Grant permissions to the RAM user
Click the RAM user name. On the Permissions tab, click Grant Permission.
Search for and select the following policies, then click Grant permissions:
AliyunSTSAssumeRoleAccessAliyunARMSFullAccess
2e. Aggregate data
Log on to the ARMS console as the RAM user.
In the left-side navigation pane, choose Managed Service for Prometheus > Instances.
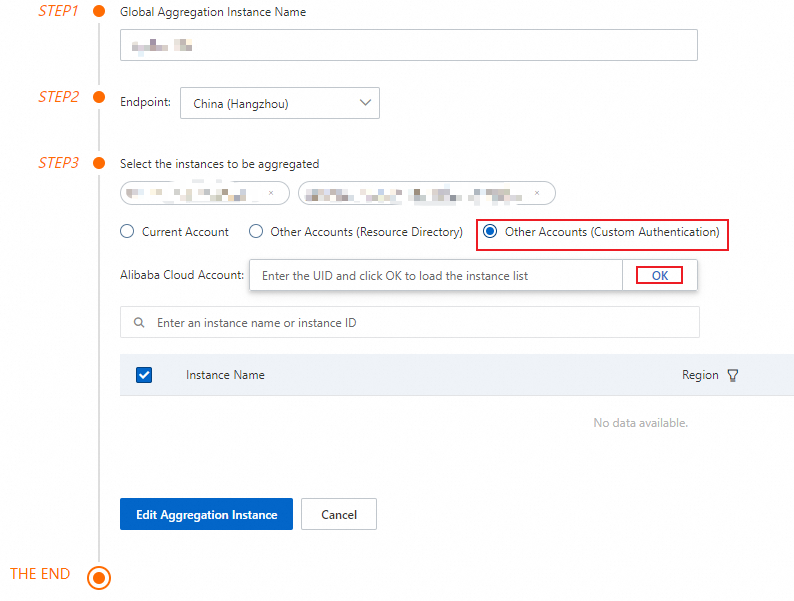
Find the global aggregation instance and click Edit in the Actions column.
In STEP3, under Select the instances to be aggregated, select Other Accounts (Custom Authentication).
In the search box next to Alibaba Cloud Account, enter the ID of Account B and click OK.
Select the Prometheus instances to aggregate and click Edit Aggregate Instance.
Only the RAM user -- not the Alibaba Cloud account that owns the RAM user -- can modify Prometheus instances from another account through custom authentication.
Step 2: Query aggregated data
After you create the global aggregation instance, view metrics through built-in Grafana dashboards:
On the Instances page, click the name of the global aggregation instance.
In the left-side navigation pane, click Dashboards.
Step 3: Create alert rules
On the Instances page, click the name of the global aggregation instance.
In the left-side navigation pane, click Alert rules.
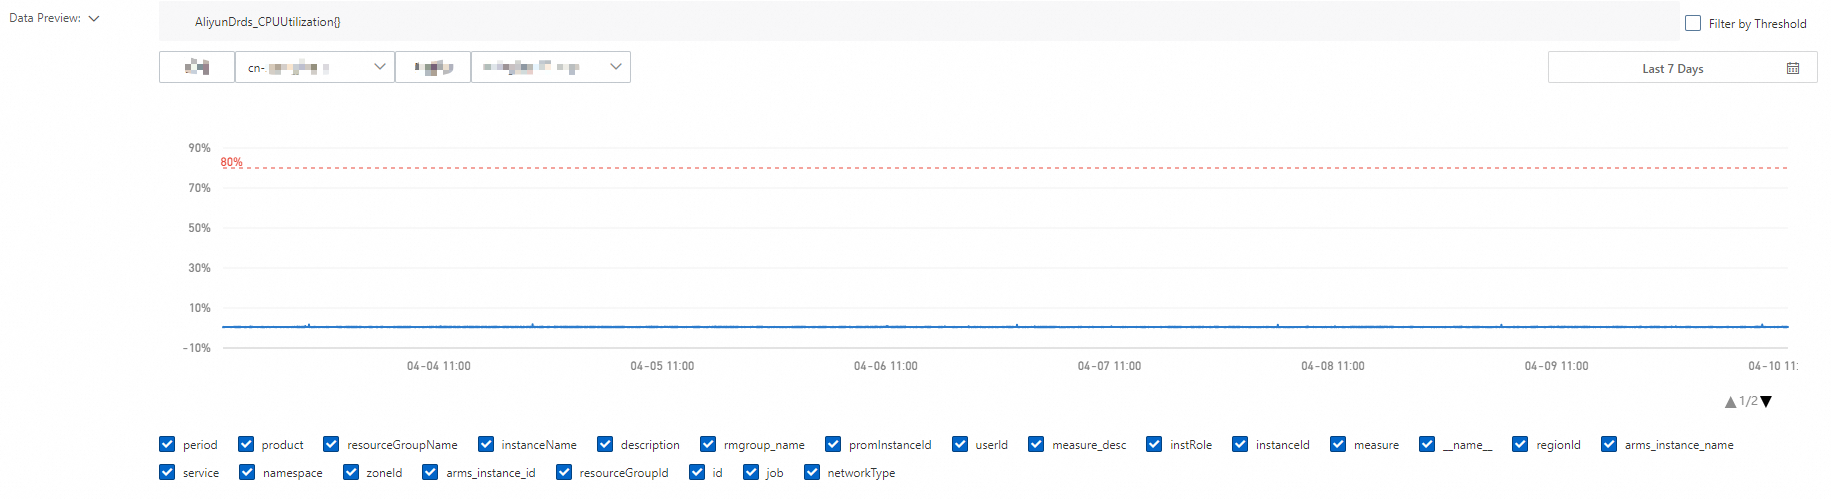
On the Prometheus Alert Rules page, click Create Prometheus Alert Rule and configure the alert as needed. For more information, see Create an alert rule for a Prometheus instance.
The Data Preview section displays unique_cluster_id and unique_cluster_name for the global aggregation instance. Use these fields to identify which source instance triggered an alert.
Manage a global aggregation instance
Edit the instance
On the Instances page, find the global aggregation instance and click Edit in the Actions column.
Do not change the Endpoint region unless absolutely necessary. Changing the region invalidates all alert rules configured in the original region.
Uninstall the instance
On the Instances page, find the global aggregation instance and click Uninstall in the Actions column.
Click OK to confirm.
The instance is removed from the Instances page after uninstalling.
FAQ
Does a global aggregation instance incur charges?
Global aggregation instances are currently in public preview and free of charge.
Does a global aggregation instance copy data from source instances?
No. A global aggregation instance provides a unified query entry point. It reads metrics directly from the source Prometheus instances without copying or synchronizing data.