Spring Boot applications running in Kubernetes need observability into request latency, error rates, JVM health, and business-specific counters. Managed Service for Prometheus collects these metrics through the OpenMetrics standard, stores them for long-term querying, and integrates with Grafana for visualization and alerting.
This guide walks through instrumenting a Spring Boot application with Micrometer, deploying it to Kubernetes, configuring service discovery, and building Grafana dashboards.
How it works
Spring Boot Actuator exposes application metrics through Micrometer, a vendor-neutral metrics facade that can be seen as the Simple Logging Facade for Java (SLF4J) for monitoring. You can use Micrometer to connect your applications to various monitoring systems, such as AppOptics, Datadog, Elastic, InfluxDB, and Managed Service for Prometheus. Micrometer maps Java metric types to Prometheus metric types and serves them at an HTTP endpoint in OpenMetrics text format. The most common methods of collecting monitoring data are pushing and pulling. Managed Service for Prometheus uses the pulling method: it periodically scrapes this endpoint to collect and store the metrics.

The end-to-end workflow:
Add Maven dependencies for Spring Boot Actuator and Micrometer Prometheus registry.
Instrument your application code with annotations or custom metrics.
Deploy the application to a Kubernetes cluster with Managed Service for Prometheus enabled.
Configure a ServiceMonitor so Managed Service for Prometheus discovers the metrics endpoint.
Build Grafana dashboards and alert rules for your metrics.
OpenMetrics data model
OpenMetrics is a cloud-native and highly scalable metric protocol that supports both text representation protocols and Protocol Buffers. Text representation protocols are more commonly used. By default, Managed Service for Prometheus uses text representation protocols when it captures data.
Each metric in the OpenMetrics text format consists of a name, a set of key-value labels, a float64 value, and a millisecond-precision UNIX timestamp.
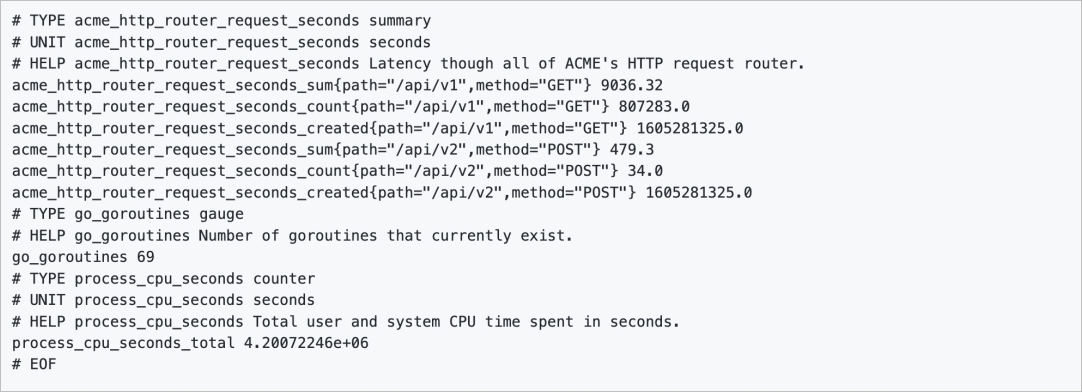
For example, acme_http_router_request_seconds_sum{path="/api/v1",method="GET"} identifies a time series by its metric name (acme_http_router_request_seconds_sum) and labels (path, method). Samples collected over time form a time series that you can query and chart in Grafana.
Metric type mappings
Micrometer maps its metric types to Prometheus metric types as follows:
| Micrometer type | Prometheus type | Use case |
|---|---|---|
| Counter | Counter | Monotonically increasing values: page views (PV), unique visitors (UV), API call counts, cache hits |
| Gauge | Gauge | Fluctuating values: resource usage, system load, request queue length |
| Timer | Histogram | Latency distributions: 50th, 90th, and 99th percentile latency of API calls |
| DistributionSummary | Summary | Data distribution statistics, similar to Histogram but calculated on the client side (results from multiple machines cannot be aggregated) |
The Timer metric type provides the same information as the Counter metric type. For example, a Timer metric that collects data about the response time of an API also collects the number of visits. You do not need to configure metrics of both types for the same API.
What you can monitor
After connecting your application, the following metric categories become available:
| Category | Description | Examples |
|---|---|---|
| Frontend request health (RED metrics) | Rate, Errors, and Duration for Spring Web MVC endpoints | Requests per second, failed request count, latency per request |
| Backend resource usage | In-process resource metrics | Thread pool queue depth, Guava Cache hit ratios |
| Custom business metrics | Any counter, gauge, or timer specific to your application | Unique visitors (UV) for an API |
| JVM internals | Java Virtual Machine runtime metrics | Garbage collection activity, heap and non-heap memory usage, uptime |
Prerequisites
Before you begin, make sure that you have:
A Spring Boot 2.0 or later application
A Kubernetes cluster with Managed Service for Prometheus enabled (see Monitor an ACK cluster)
A Managed Service for Prometheus instance (see Instance management)
Step 1: Add dependencies and expose the metrics endpoint
This guide uses a cloud-native microservice application built with Spring Boot and Spring Cloud Alibaba as an example.
Add Maven dependencies
Add Spring Boot Actuator and the Micrometer Prometheus registry to your pom.xml:
<!-- Spring Boot Actuator: exposes operational endpoints -->
<dependency>
    <groupId>org.springframework.boot</groupId>
    <artifactId>spring-boot-starter-actuator</artifactId>
</dependency>
<!-- Micrometer Prometheus registry: formats metrics for Prometheus -->
<dependency>
    <groupId>io.micrometer</groupId>
    <artifactId>micrometer-registry-prometheus</artifactId>
</dependency>
Having micrometer-registry-prometheus on the classpath is enough for Spring Boot to auto-configure the Prometheus registry. No additional code is required for basic JVM and HTTP metrics.
Configure the metrics endpoint
Add the following properties to your application.properties file to expose metrics on a dedicated port:
spring.application.name=frontend

# Serve actuator endpoints on a separate port
management.server.port=8091
# Expose all actuator endpoints, including /actuator/prometheus
management.endpoints.web.exposure.include=*
# Tag all metrics with the application name for filtering in dashboards
management.metrics.tags.application=${spring.application.name}| Property | Purpose |
|---|---|
management.server.port | Separates the metrics endpoint from the application port to avoid exposing actuator endpoints to external traffic |
management.endpoints.web.exposure.include | Controls which actuator endpoints are accessible over HTTP |
management.metrics.tags.application | Adds an application label to all metrics for filtering in Grafana dashboards |
After configuration, Managed Service for Prometheus scrapes metrics in OpenMetrics format from http://<pod-ip>:8091/actuator/prometheus.
Step 2: Instrument your application
Track API latency with @Timed
Add a @Timed annotation to any controller method to capture rate, error, and duration (RED) metrics:
@Timed(value = "main_page_request_duration",
       description = "Time taken to return main page",
       histogram = true)
@ApiOperation(value = "Main page", tags = {"Main page"})
@GetMapping("/")
public String index(Model model) {
    model.addAttribute("products", productDAO.getProductList());

    model.addAttribute("FRONTEND_APP_NAME", Application.APP_NAME);
    model.addAttribute("FRONTEND_SERVICE_TAG", Application.SERVICE_TAG);
    model.addAttribute("FRONTEND_IP", registration.getHost());

    model.addAttribute("PRODUCT_APP_NAME", PRODUCT_APP_NAME);
    model.addAttribute("PRODUCT_SERVICE_TAG", PRODUCT_SERVICE_TAG);
    model.addAttribute("PRODUCT_IP", PRODUCT_IP);

    model.addAttribute("new_version", StringUtils.isBlank(env));
    return "index.html";
}| Parameter | Effect |
|---|---|
value | Sets the metric name exposed at /actuator/prometheus |
histogram = true | Generates a Histogram metric type, which enables p90 and p99 latency calculations |
Monitor Guava Cache health
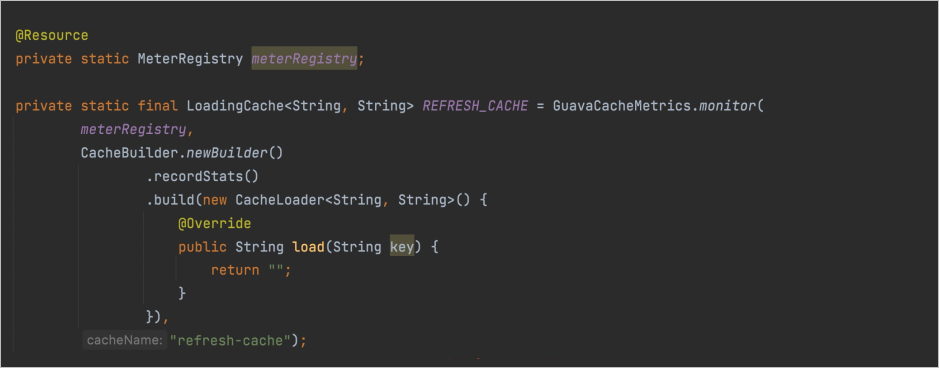
If your application uses Guava Cache, wrap it with Micrometer to track hit ratios and eviction counts:
Inject
MeterRegistry. Spring Boot auto-injectsPrometheusMeterRegistry.Call
GuavaCacheMetrics.monitorto register cache metrics.Enable statistics collection with
.recordStats().Set a descriptive cache name for the generated metrics.
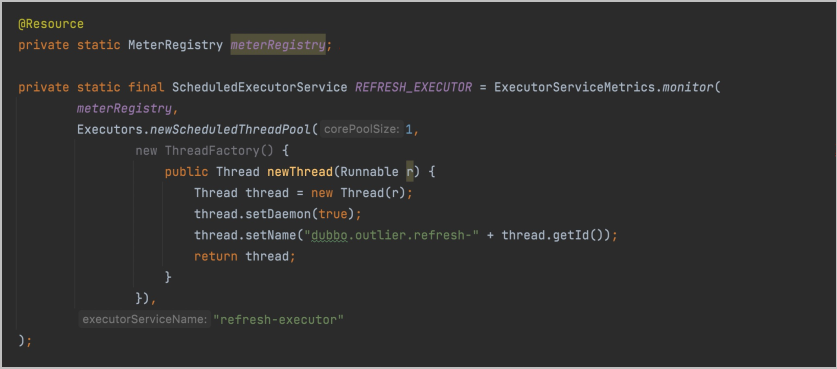
Monitor thread pool utilization
Inject
MeterRegistry.Wrap the thread pool with a Micrometer utility class.
Set a descriptive thread pool name for the generated metrics.
Register custom business metrics
To track metrics specific to your business logic, inject MeterRegistry into any bean and register Counter, Gauge, or Timer metrics:
@Service
public class DemoService {

    Counter visitCounter;

    public DemoService(MeterRegistry registry) {
        visitCounter = Counter.builder("visit_counter")
            .description("Number of visits to the site")
            .register(registry);
    }

    public String visit() {
        visitCounter.increment();
        return "Hello World!";
    }
}
Step 3: Deploy and configure service discovery
After instrumenting your application:
Rebuild the application image and deploy it to a Kubernetes cluster with Managed Service for Prometheus enabled.
Create a ServiceMonitor custom resource definition (CRD) in the Managed Service for Prometheus console to discover the Service that exposes your application.
For detailed instructions, see Monitor an ACK cluster and Instance management.
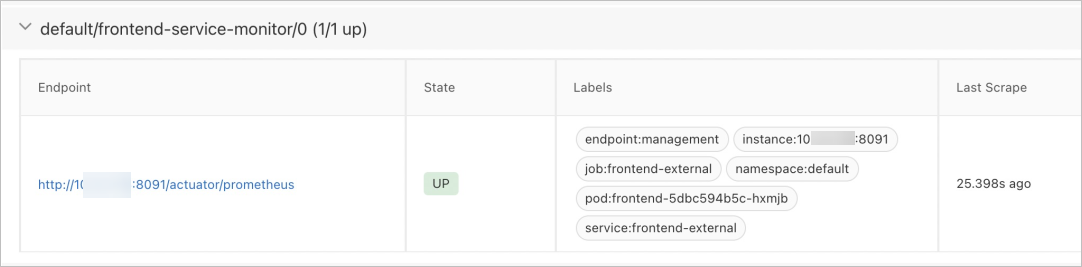
Verify service discovery
After the ServiceMonitor is configured, confirm that the application appears on the Targets tab of the Service Discovery page.
Step 4: Build dashboards and alert rules
Import community dashboard templates
The Grafana community provides two dashboard templates that cover Spring Boot and JVM metrics:
Spring Boot 2.1 Statistics: request rate, error rate, and response time.
JVM (Micrometer): memory usage, garbage collection, and thread activity.
Import these templates into the Grafana instance provided by Managed Service for Prometheus, then customize them for your specific metrics.
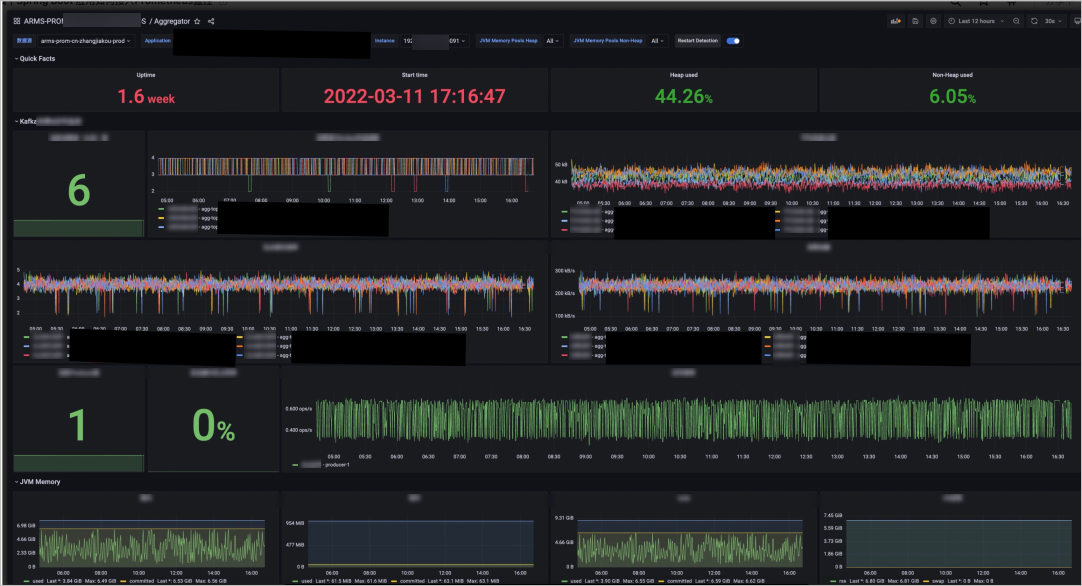
Example dashboard
The following dashboard combines community templates with custom business metrics. It shows uptime, memory usage, heap and non-heap memory allocation, and garbage collection data across generations.
Configure alert rules
You can configure alert rules for key metrics to detect issues before they affect users.