When you use Browser Monitoring, costs accrue based on your billing model. ARMS provides two ways to track these costs: the Expenses and Costs console for billing records, and the ARMS console for real-time consumption statistics and resource plan balances.
Billing models
ARMS Browser Monitoring supports two billing models. Where you check your bills depends on which model you use.
| Billing model | Where to check | What you see |
|---|---|---|
| Pay-as-you-go | Expenses and Costs console | Itemized billing records by cycle, account, or instance |
| Resource plans | ARMS console (Overview page) | Remaining plan balance and available resources |
View pay-as-you-go bills
To view itemized billing records for pay-as-you-go usage:
Log on to the Expenses and Costs console.
In the left-side navigation pane, choose .
Click the Billing Details tab.
Set the filter conditions such as Billing Cycle, Account/Owner Account, and Product Details, then click Search.
To view bills grouped by instance, set Statistic Item to Instance.
Cost centers can also help you track instance-level expenditures.
Check resource plan usage
If you purchased resource plans, check remaining balances in the ARMS console:
Log on to the ARMS console.
On the Overview page, check the number of remaining resource plans.
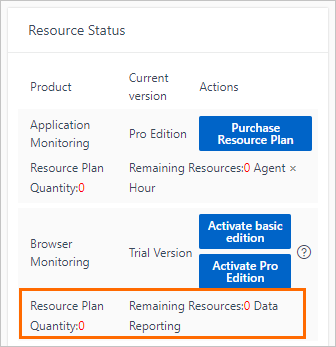
Click the number to view available resources.
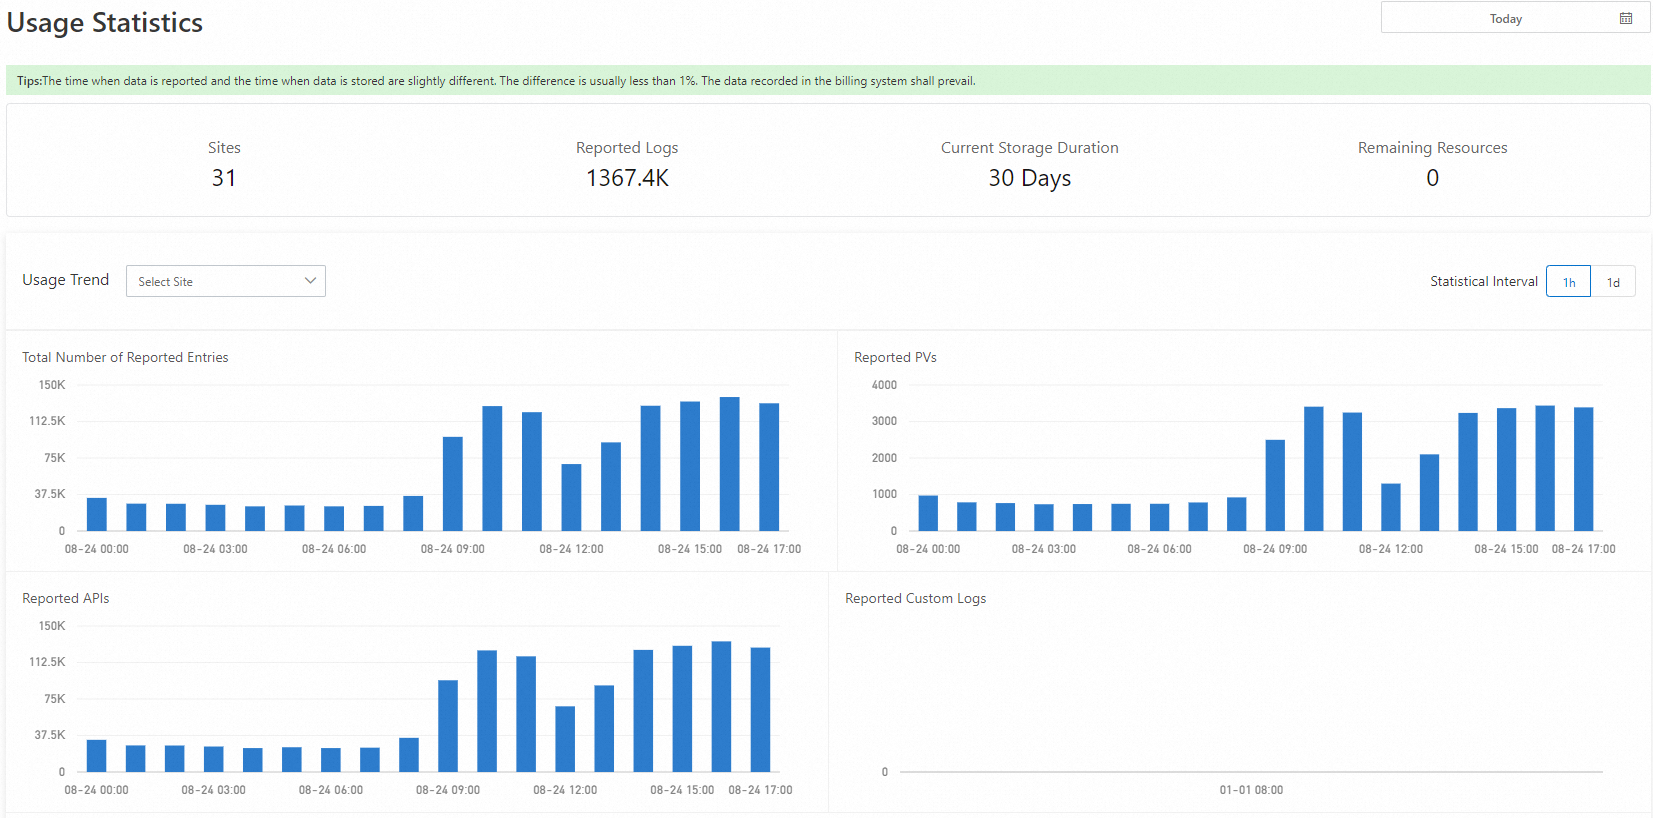
View consumption data
Browser Monitoring Pro Edition displays per-application resource consumption data, filtered by time range.
Reported resource types
PV, API, or custom data can be reported once for each resource. The following table describes these event types:
| Event type | Description |
|---|---|
| PV | A page view recorded by the browser |
| API call | An API request captured by Browser Monitoring |
| Custom data | A custom event reported by the application |
Check consumption statistics
Log on to the ARMS console.
In the left-side navigation pane, choose .
In the upper-right corner, select a time period.
The page displays resource consumption for the selected range, either for a specific application or across all applications.