Slow application responses can originate anywhere along the request path -- frontend, gateway, application server, or database. In microservice architectures, a single request spans services maintained by different teams, and logging every potential bottleneck is costly.
Application Monitoring in ARMS (Application Real-Time Monitoring Service) addresses this by automatically tracking every interface your application exposes and flagging slow calls -- without code changes. After you install an ARMS agent, it continuously profiles your application, captures distributed traces, and monitors interface performance.
This guide walks you through a troubleshooting workflow: check health metrics, identify slow interfaces, and drill into traces and method stacks to find the root cause.
Prerequisites
Before you begin, make sure that you have:
An Alibaba Cloud account with ARMS activated
An application connected to ARMS Application Monitoring with an ARMS agent installed. For installation methods, see Application Monitoring overview
Step 1: Check application health and slow SQL metrics
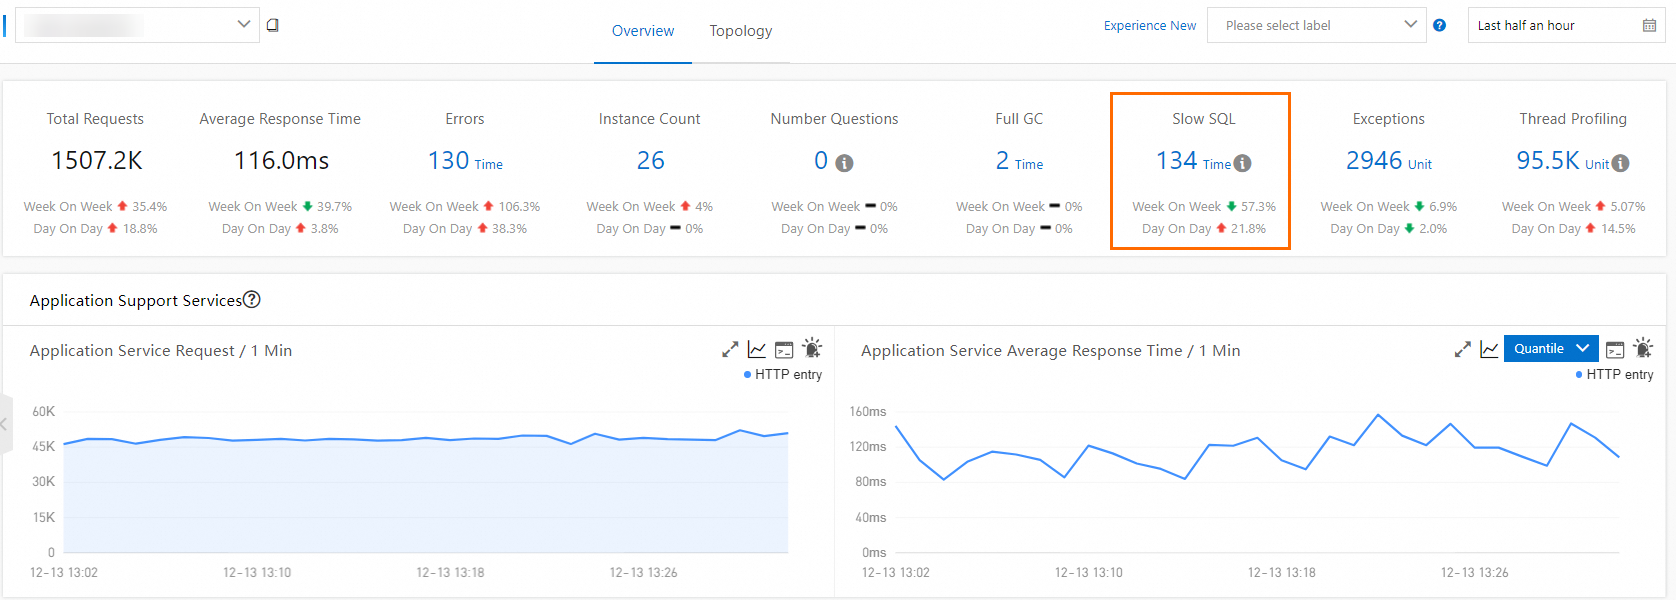
The Application Overview page provides a snapshot of your application's health. It tracks the following metrics and shows day-over-day and week-over-week trends:
| Metric | What it tells you |
|---|---|
| Average response time | Overall latency experienced by callers |
| Total requests | Traffic volume during the selected period |
| Errors | Failed requests that may indicate bugs or downstream issues |
| Real-time instances | Number of active application instances |
| Full GC occurrences | Garbage collection pauses that can cause stuttering |
| Slow SQL queries | Database queries exceeding the slow threshold |
| Exceptions | Runtime exceptions thrown by the application |
| Slow calls | Interface calls exceeding the response time threshold |
Log on to the ARMS console. In the left-side navigation pane, choose Application Monitoring > Application List.
On the Application List page, select a region in the top navigation bar, then click the name of your application.
NoteIf the
 icon appears in the Language column, the application is connected to Application Monitoring. If a hyphen (-) appears, the application is connected to Managed Service for OpenTelemetry.
On the Application Overview page, click the Overview tab. The tab displays the total number of slow SQL queries along with day-over-day and week-over-week changes. A rising slow SQL count often signals a database-related bottleneck worth investigating first.
Step 2: Identify slow interfaces
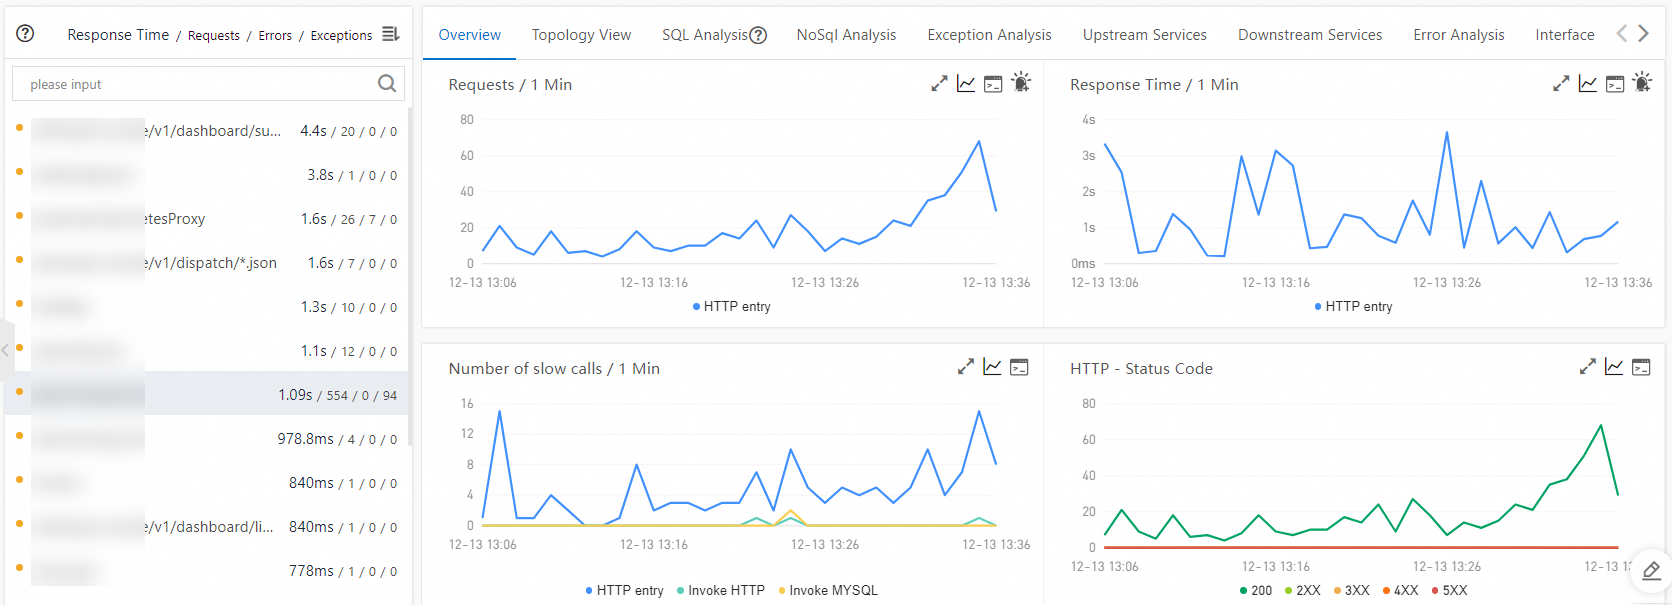
The Interface Invocation page lists every interface your application exposes, along with its call count and response time. ARMS marks slow interfaces so you can quickly identify which endpoints need attention.
In the left-side navigation pane, click Interface Invocation.
In the left-side panel, click a slow interface to view its details. Focus on interfaces with high response times or a large number of slow calls. These are the most likely sources of user-facing latency.
Step 3: Locate the faulty code with trace details
After you identify a slow interface, drill into its traces to find the specific code responsible. Interface snapshots capture complete trace records -- every call in the chain and its duration -- so you can pinpoint exactly where time is spent.
On the right side of the Interface Invocation page, click the Interface snapshot tab. This tab displays all captured traces for the selected interface.
Click a trace ID to open the trace details.
In the trace details panel, review the call hierarchy and timing breakdown. In the Details column, click the magnifier icon to inspect method stacks and context information.
NoteFor more ways to query and filter traces, see Trace query.
After you identify the root cause of a specific slow call, return to the Interface Invocation page and repeat this process for other slow interfaces in the list.
Set up alerting for ongoing monitoring
To catch performance regressions early, configure alert rules for one or more interfaces. When exceptions occur, ARMS sends alert notifications to your operations team automatically.
For details, see Application Monitoring alert rules.