ARMS Application Monitoring collects JVM memory metrics to help you identify memory leaks, tune garbage collection, and right-size heap and non-heap allocations. This topic explains the memory areas that ARMS monitors, how the data is collected, and how to troubleshoot common memory issues.
The ARMS agent collects memory data through MemoryMXBean in the Java Development Kit (JDK). Due to MemoryMXBean limitations, ARMS cannot monitor all memory areas of a Java process -- VM thread stacks and Java Native Interface (JNI) memory are excluded. For details, see Interface MemoryMXBean.
Java process memory layout
The following diagram shows the main memory areas of a Java process.

This diagram covers the main memory areas only. The actual JVM memory structure is more complex.
Heap memory
The heap is the primary memory area where the JVM allocates objects and runs garbage collection (GC). ARMS reports heap usage through MemoryMXBean, but the reported maximum may be slightly smaller than the value set through -Xmx, depending on the garbage collector in use.
Why the reported maximum differs from -Xmx
MemoryMXBean excludes the From Space and To Space survivor areas from its heap calculation. This causes a discrepancy for certain collectors:
| Garbage collector | Reported max vs. -Xmx |
|---|---|
| Garbage-First (G1) Garbage Collector | Matches -Xmx or -XX:MaxRAMPercentage |
| Parallel Garbage Collector (ParallelGC) | Slightly below -Xmx |
| Concurrent Mark Sweep (CMS) Collector | Slightly below -Xmx |
| Serial Garbage Collector | Slightly below -Xmx |
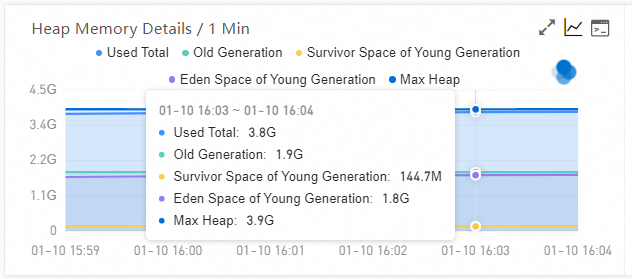
Example: With -XX:+UseParallelGC -Xms4096m -Xmx4096m, ARMS reports a maximum of approximately 3.8 GB instead of 4 GB.
Non-heap memory
Non-heap memory reported by ARMS is the sum of three areas:
Non-heap memory = Metaspace + Compressed class space + Code cache

VM thread stacks and JNI memory are not included in the non-heap total because MemoryMXBean does not track them.
Metaspace
Stores class metadata -- class structures, methods, and fields. Usage is generally stable after application startup.
| JVM parameter | Purpose |
|---|---|
-XX:MetaspaceSize=N | Initial metaspace size (JDK 8+) |
-XX:MaxMetaspaceSize=N | Maximum metaspace size (JDK 8+) |
Compressed class space
Stores loaded class metadata in a compressed format. By limiting pointer size, compressed class space reduces the memory footprint of Java applications. The default size in JDK 11 is 1 GB.
| JVM parameter | Purpose |
|---|---|
-XX:CompressedClassSpaceSize | Set the compressed class space size |
Code cache
Stores native code generated by the JVM, including interpreter loops, JNI stubs, just-in-time (JIT) compiled methods, and Java methods. JIT output accounts for most of the code cache usage.
| JVM parameter | Purpose |
|---|---|
-XX:InitialCodeCacheSize | Initial code cache size |
-XX:ReservedCodeCacheSize | Maximum code cache size |
Direct buffer
Direct buffers allocate memory in the operating system rather than in the JVM heap. Because they skip the copy between JVM and OS memory, they provide faster I/O performance and efficiently process large amounts of data -- but heavy I/O operations increase direct buffer memory consumption accordingly.
Troubleshoot memory leaks
Heap memory leaks
If heap memory grows steadily over time, a leak may exist. ARMS provides two features for heap memory leak analysis:
Memory snapshot -- Capture a heap snapshot to inspect object allocation.
Continuous profiling -- Track allocations over time to identify the source of the leak.
Start by checking the JVM heap memory chart in Application Monitoring. If the used heap trends upward across multiple GC cycles, take a memory snapshot or enable continuous profiling.
Non-heap memory leaks
If heap memory is stable but overall process memory keeps growing, a non-heap leak is likely. ARMS does not analyze non-heap memory directly. Use the Native Memory Tracking (NMT) tool provided by the JDK to monitor non-heap memory allocations.
For details, see Native Memory Tracking in the Oracle documentation.
NMT requires technology background and adds a 5%--10% performance overhead. Evaluate the impact before enabling it in production.
FAQ
Why does memory in Application Monitoring differ from top output?
Application Monitoring collects data through Java Management Extensions (JMX), which covers only JVM-managed heap and non-heap areas. The Resident Memory Size in KiB (RES) reported by top includes additional memory -- VM thread stacks, local thread stacks, and non-JVM allocations -- that JMX does not track.
Why does memory in Application Monitoring differ from Managed Service for Prometheus or Managed Service for Grafana?
The two systems use different data sources. Application Monitoring reads JMX metrics from inside the JVM. Managed Service for Grafana queries container-level metrics through Prometheus Query Language (PromQL) -- typically container_memory_working_set_bytes, which represents the sum of Resident Set Size (RSS) and active cache of memory cgroups. This is a broader scope than JMX.
A pod restarts due to an out-of-memory (OOM) killer. How do I troubleshoot with Application Monitoring?
Application Monitoring helps troubleshoot heap memory and direct buffer capacity planning, but it does not capture full-process RSS details. For OOM killer investigations, use the Prometheus monitoring ecosystem on Kubernetes to track container-level memory.
Check two things:
Other processes in the pod -- Verify that the pod runs a single Java process. Additional sidecar or helper processes may consume memory outside JVM monitoring.
Leaks outside the JVM -- Libraries such as glibc can cause native memory leaks invisible to JMX. Use NMT or OS-level tools to investigate.