Application Monitoring eBPF Edition of Application Real-Time Monitoring Service (ARMS) is an end-to-end observability service developed for Kubernetes clusters. It monitors metrics, application traces, logs, and events of Kubernetes clusters. Application Monitoring eBPF Edition is designed to provide an overall observability solution for IT developers and O&M personnel.
Application Monitoring eBPF Edition is currently being public preview. You can use Alibaba Cloud Application Monitoring eBPF Edition for free during the public preview period. If you have any questions, contact the Application Monitoring eBPF Edition Q&A DingTalk group (group ID: 35568145) for help.
Features
Feature | Description |
Zero code intrusion | Application Monitoring eBPF Edition uses bypass technologies to obtain abundant network performance data, without the need to instrument business code. |
Language independence | Application Monitoring eBPF Edition parses network protocols at the kernel level and supports all programming languages and frameworks. |
High performance | Application Monitoring eBPF Edition is developed based on the extended Berkeley Packet Filter (eBPF) technology. Application Monitoring eBPF Edition can obtain abundant network performance data by consuming only a few resources. |
Display of resource correlations | Application Monitoring eBPF Edition displays correlations between resources in network topologies and resource topologies. |
Data variety | Application Monitoring eBPF Edition supports various forms of observable data, such as metrics, traces, logs, and events. |
Integrity | The ARMS console provides preset scenarios to integrate Application Monitoring eBPF Edition with architecture discovery, Alibaba Cloud Managed Service for Prometheus, alert configurations, and cluster management. |
Features
Resource performance monitoring
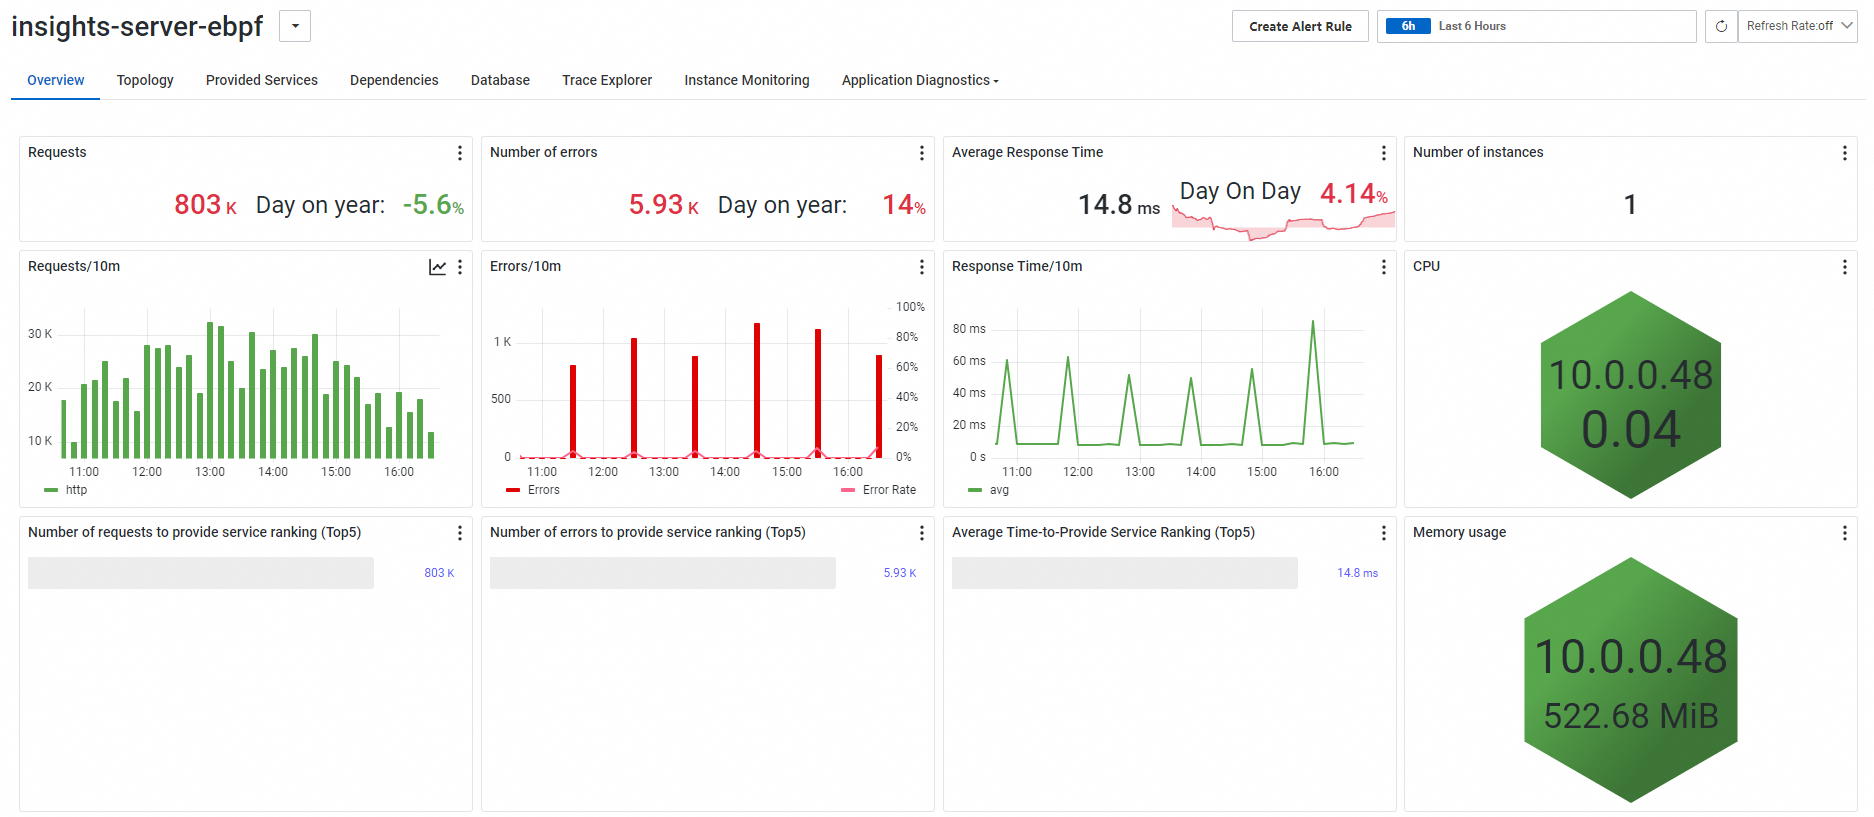
Application Monitoring eBPF Edition uses the eBPF technology to obtain the following performance data of containers without code intrusion: the number of requests, the number of failed requests, and the response time. Application Monitoring eBPF Edition can efficiently discover performance issues within containers and pods. In addition, Application Monitoring eBPF Edition can identify the services and controller workloads that are associated with the issues. The controller workloads include Deployments, StatefulSets, and DaemonSets. This improves troubleshooting efficiency.
Cluster network topologies and network tracking
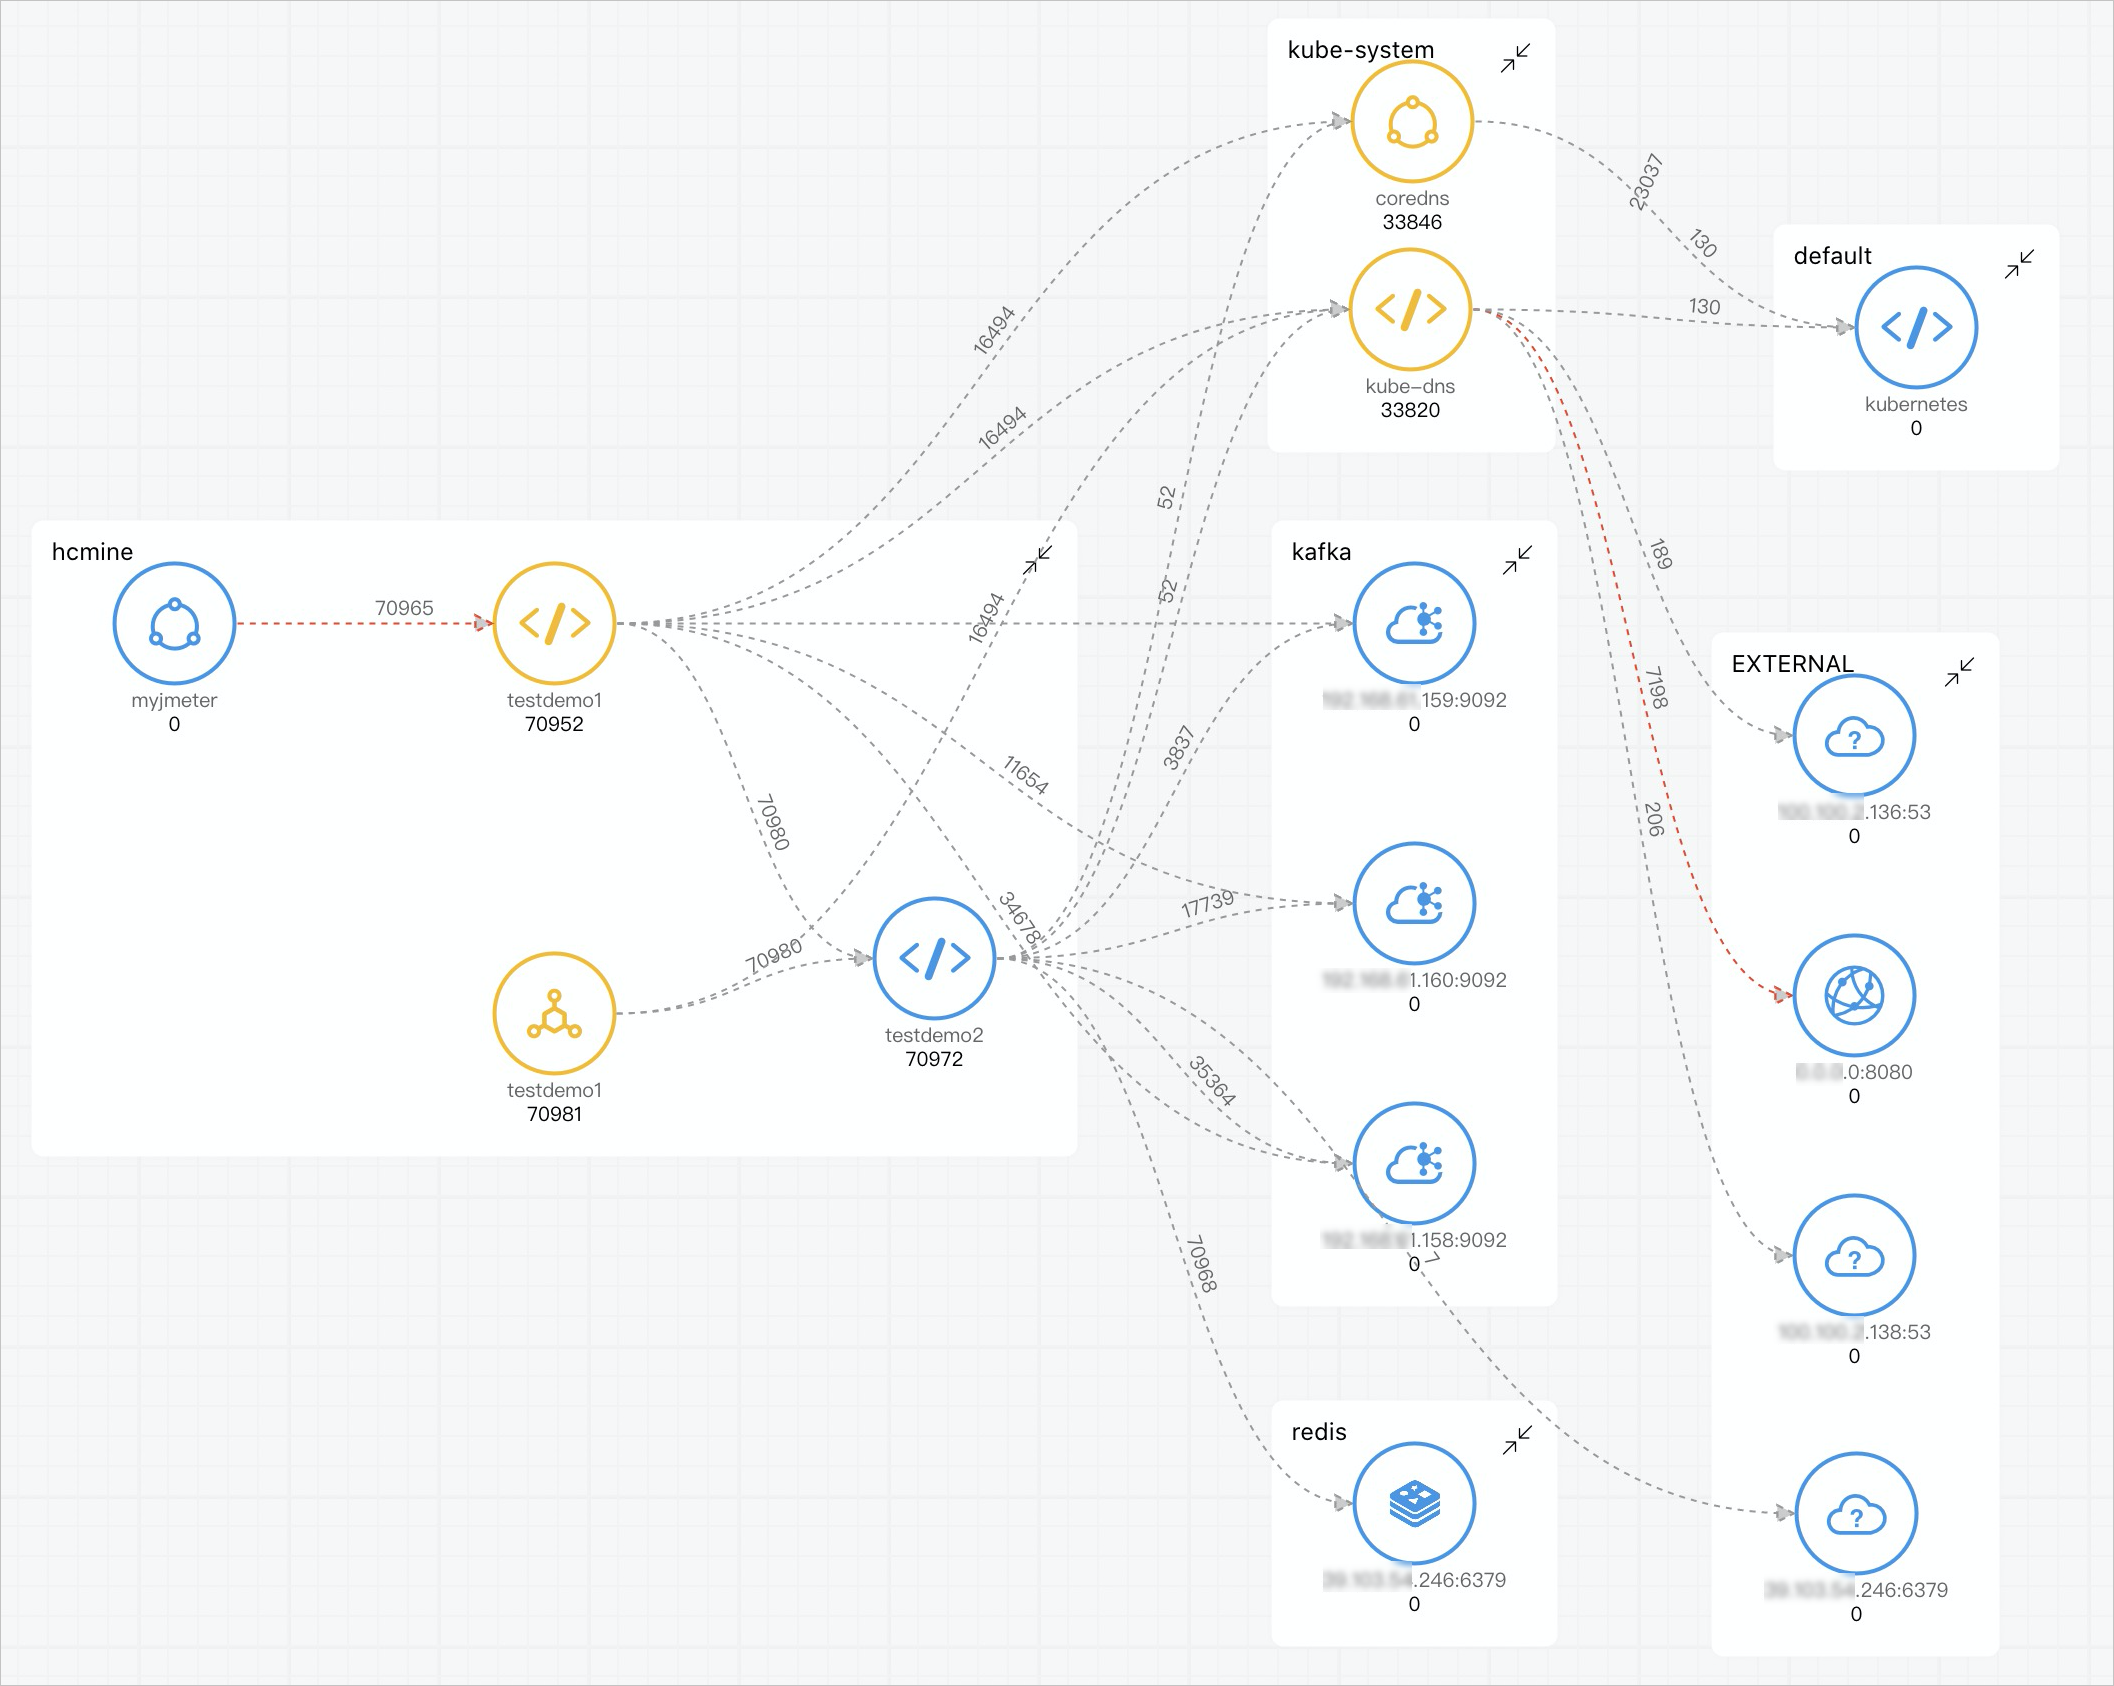
Application Monitoring eBPF Edition can analyze network requests and automatically parse network protocols to generate network topologies. Application Monitoring eBPF Edition supports the HTTP, Redis, Kafka, and MySQL protocols.
Each network topology displays the network performance between containers or between a container and an Alibaba Cloud service instance. You can efficiently identify performance issues within the relevant Alibaba Cloud services based on the topology.
By default, Application Monitoring eBPF Edition stores the logs of failed requests and slow requests. Failed requests are the requests for which an HTTP status code greater than or equal to 300 is returned. Slow requests are the requests whose response time exceeds 500 milliseconds. You can view the logs to troubleshoot the errors.
Alert configurations
Application Monitoring eBPF Edition provides out-of-the-box alert templates. You can create alert rules based on preset alert templates or customize alert rules for specific Kubernetes clusters. When an alert rule is triggered, the system sends alert notifications to the specified contacts by using the specified notification methods. This reminds the contacts to take necessary measures to resolve the issue.
Monitoring of ECS resources and workload resources
Application Monitoring eBPF Edition monitors the basic metrics of Elastic Compute Service (ECS) instances to ensure that the instances have sufficient resources. The basic metrics include CPU utilization, memory usage, and disk usage.
Application Monitoring eBPF Edition monitors the basic metrics of pods and containers to ensure that the workload resources are sufficient. The basic metrics include the CPU utilization, CPU request rate, CPU limit rate, memory usage, memory request rate, memory limit rate, and disk usage.
Benefits
Compared with open source Kubernetes, Application Monitoring has the following benefits:
Innovative display of resource correlations and interactions
Application Monitoring eBPF Edition generates network topologies by monitoring network requests. In each topology, you can check the dependencies between services.

Data diversity
Application Monitoring eBPF Edition displays various types of data in a visualized manner.

Contact us
To obtain technical support of Application Monitoring eBPF Edition, join the DingTalk group (ID: 35568145).