When you monitor custom metrics in a managed Grafana 10.0.x workspace, alert rules detect threshold violations and push firing alerts to Application Real-Time Monitoring Service (ARMS) Alert Management. From ARMS, you can track alert events, define notification policies, and deliver alert cards to DingTalk groups with severity levels and custom content.
This topic describes how to create a Grafana alert rule, view alert events in ARMS, and customize alert content and severity levels.
How the integration works
Grafana 10.0.x is integrated into ARMS by default. When an alert rule fires in a managed Grafana workspace, the alert event is automatically pushed to ARMS Alert Management.
To verify this integration:
Log on to the ARMS console.
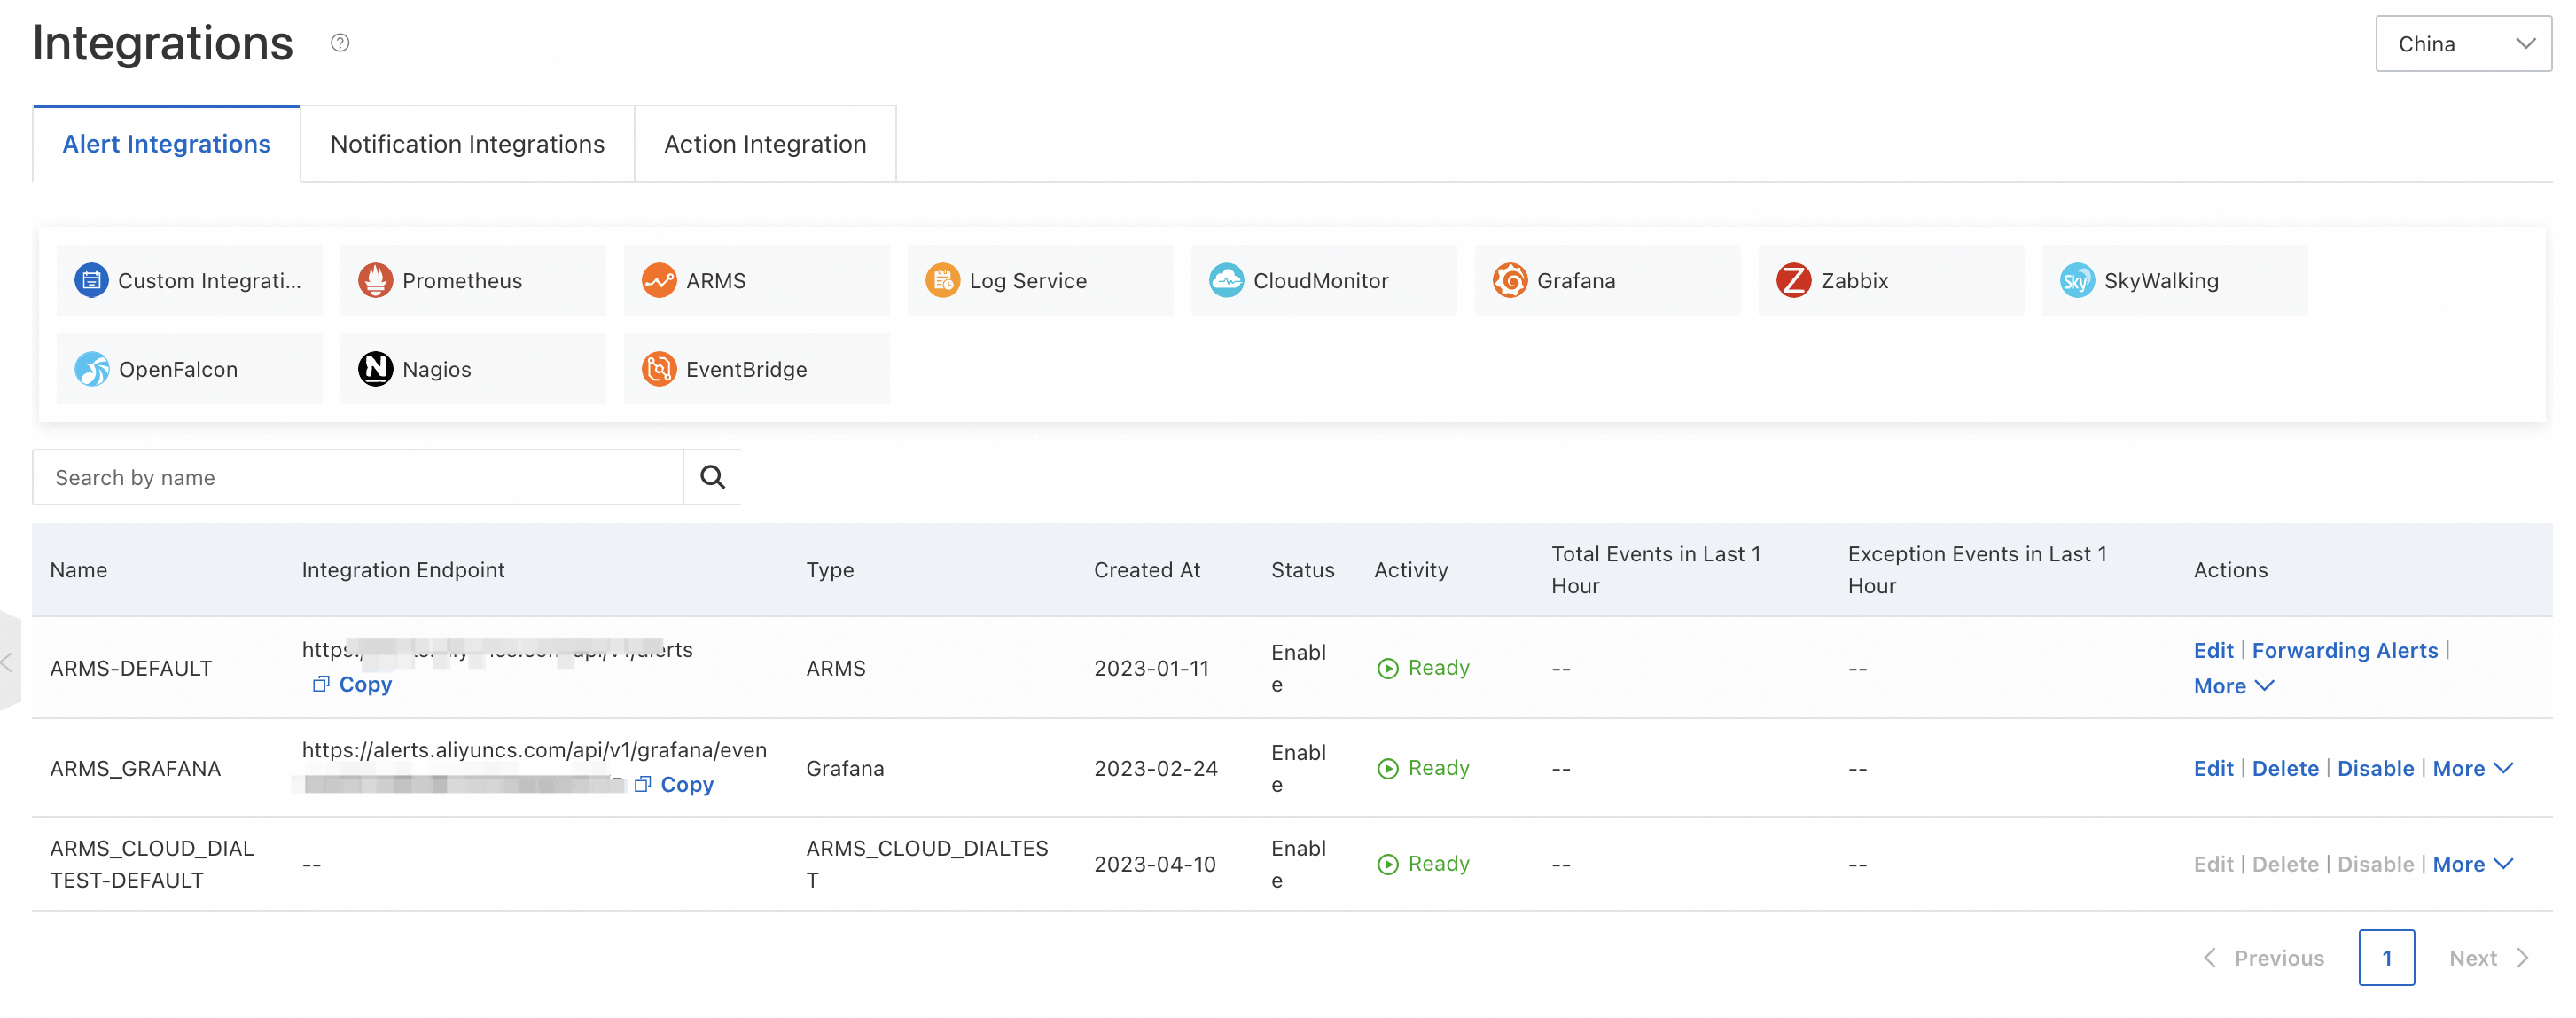
In the left-side navigation pane, choose Alert Management > Integrations.
On the Alert Integrations tab, confirm that the Grafana 10.0.x integration is active.
Prerequisites
Before you begin, make sure that you have:
A managed Grafana workspace running version 10.0.x
The administrator account credentials for the Grafana workspace, or an Alibaba Cloud account with access to the workspace
A data source configured in Grafana with metrics to monitor
Create an alert rule
Log on to the ARMS console. In the left-side navigation pane, choose Managed Service for Grafana > Workspace Management.
On the Workspace Management page, find the target workspace and click the link in the URL column to open Grafana.
NoteLog on to Grafana with the administrator account and the password configured when you created the workspace, or click Sign in with Alibaba Cloud to use your current Alibaba Cloud account.
In the Grafana navigation pane, choose Applications > ITSM or Apps > ITSM.
Click Alert rules, then click Create alert rule.
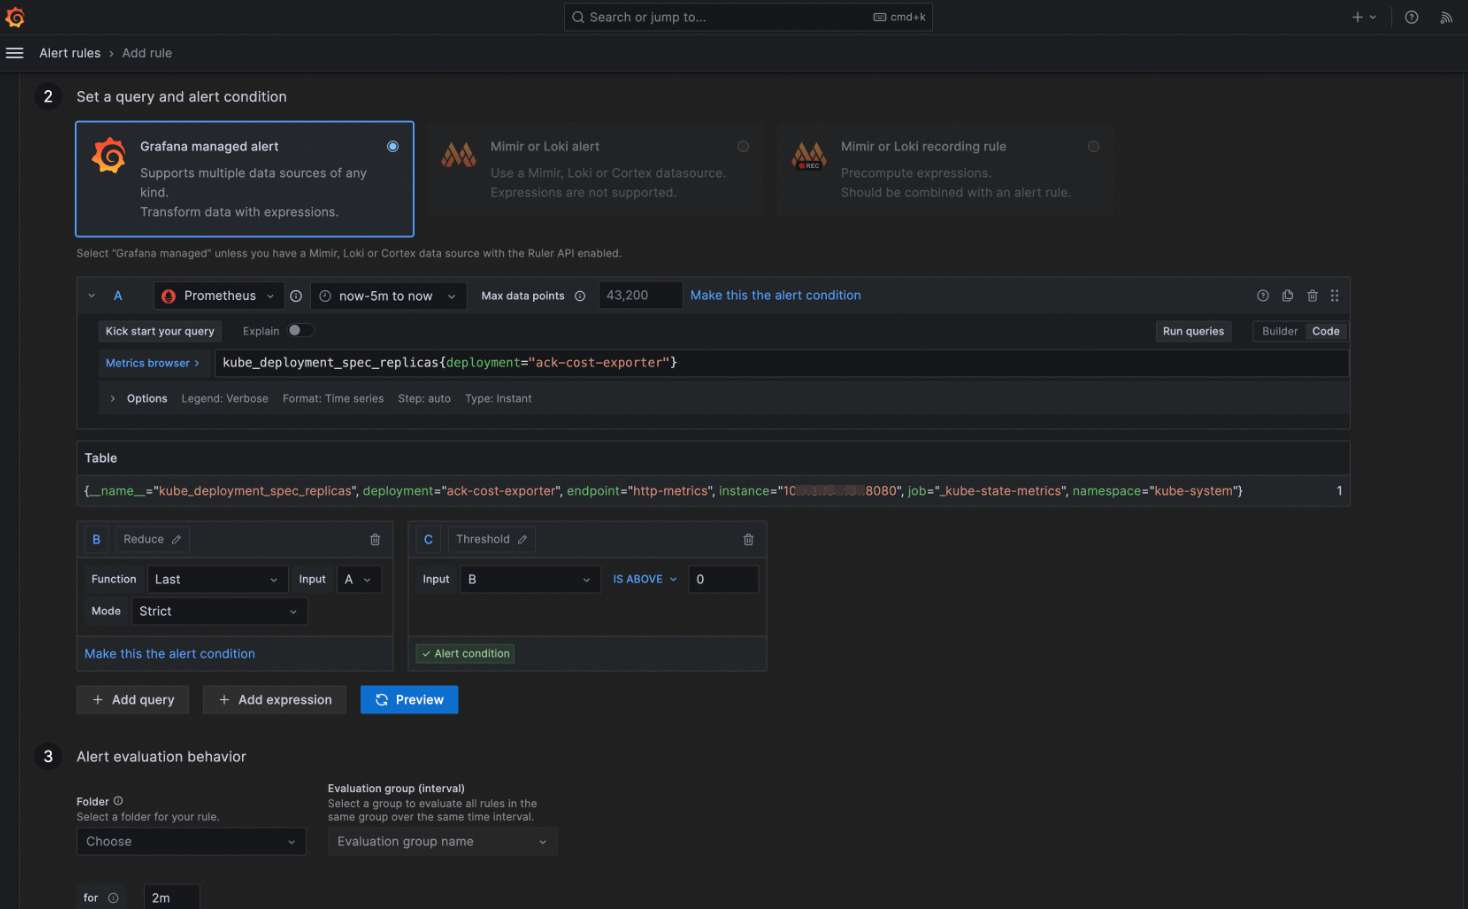
On the Add rule page, configure the following sections:
Set a query and alert condition: Define the metric query and the threshold condition that triggers the alert.
Add details for your alert rule: Set the rule name, folder, and evaluation group. Add annotations such as
messageto customize alert content. See Customize alert content.Notifications: Add labels such as
severityto control alert priority. See Configure severity levels.
Click Save rule.
View alert events and configure notifications
After an alert rule fires, the alert event appears in ARMS.
Log on to the ARMS console. In the left-side navigation pane, choose Alert Management > Alert Event History.
On the Events page, review the alert events.

Find the target event and click Create Notification Policy to define how alerts are delivered.
To verify delivery, in the left-side navigation pane, choose Alert Management > Alert Sending History and check the alert records.
After the notification policy takes effect, alert cards are pushed to the specified DingTalk group. Each alert card displays the alert details, including labels and annotations.
Customize alert content
Add a message annotation to include dynamic details in alert notifications. The message annotation maps to the event content field in ARMS Alert Management.
On the Add rule page, in the Add details for your alert rule section, add an annotation named
message.
Use Grafana template variables to include dynamic data. For example, the following template: renders as: In this example,
{{ $labels.deployment }}resolves to the deployment name from the PromQL query results, and{{ index $values "B" }}resolves to the computed value from expression B in the alert condition.Deployment {{ $labels.deployment }} has an abnormal value: {{ index $values "B" }}Deployment my-app has an abnormal value: 95.67
Template variable reference
The following variables are commonly used in the message annotation. Add other labels from your alert rule as needed.
| Variable | Description | Where to find the value |
|---|---|---|
{{ $labels.deployment }} | The deployment label from PromQL query results. | Set a query and alert condition section. 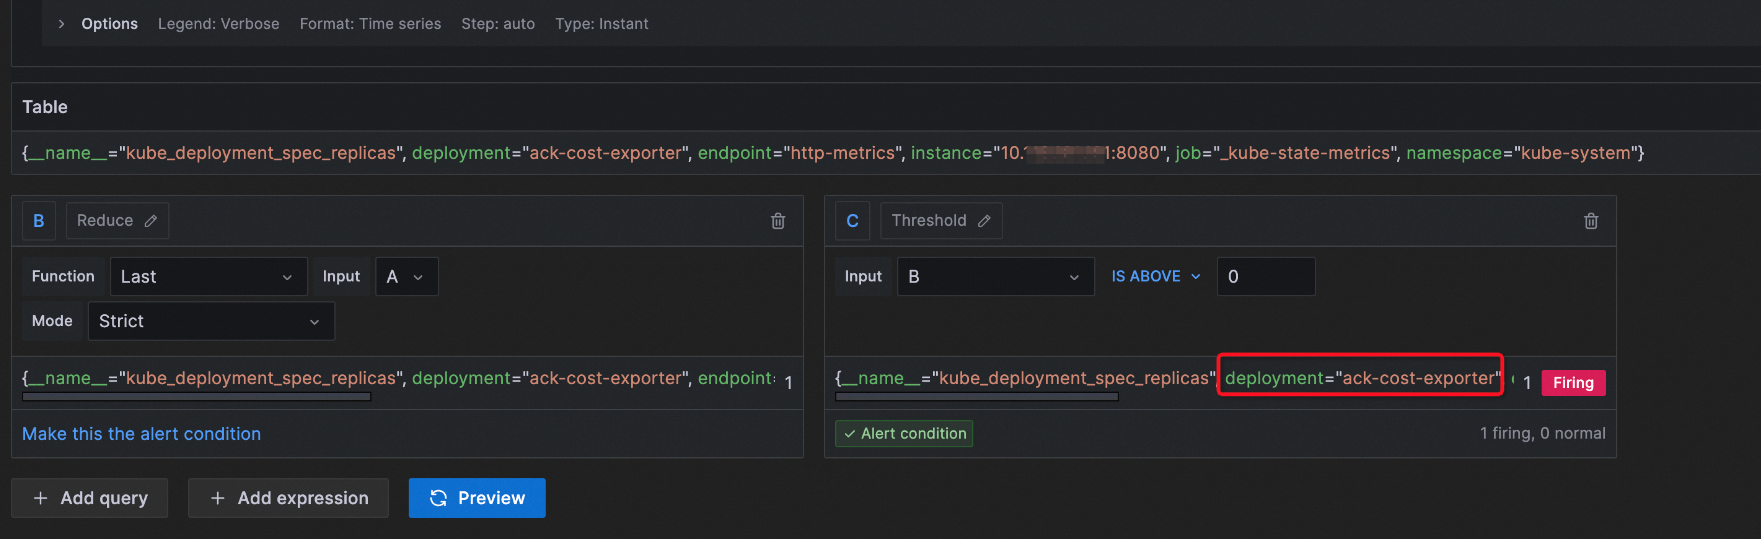 |
{{ index $values "B" }} | The computed value from expression B in the alert condition. | Set a query and alert condition section. 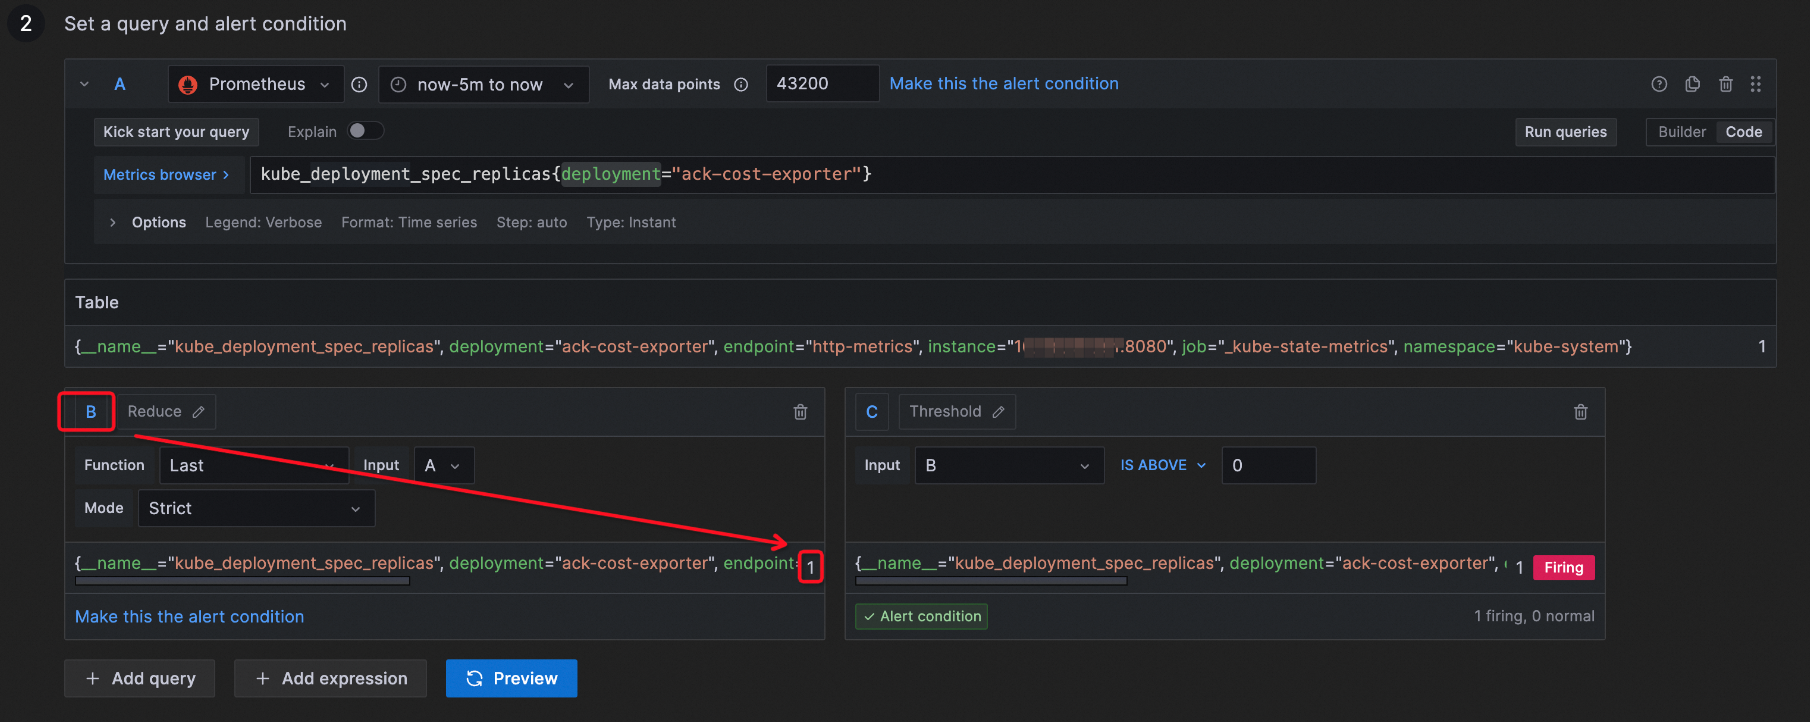 |
For the full template syntax, see Templating labels and annotations in the Grafana documentation.
After the configuration takes effect, the alert card pushed to the DingTalk group includes the custom message content.
Configure severity levels
Map Grafana severity values to ARMS alert levels by setting a severity label. This label determines the priority displayed in ARMS Alert Management and DingTalk alert cards.
On the Add rule page, in the Notifications section, add a label with the key
severity.Set the value to one of the following strings.
Grafana severity value ARMS severity level criticalP1 errorP2 warningP3 pageP4 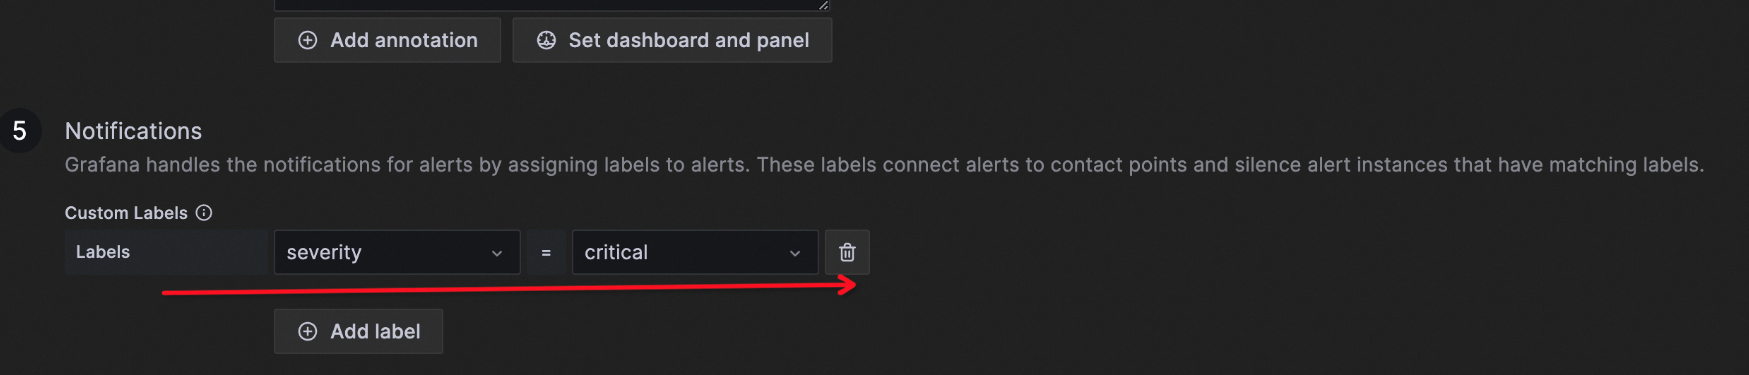
After the configuration takes effect, the alert card pushed to the DingTalk group displays the corresponding severity level.