Application Real-Time Monitoring Service (ARMS) tracks application metrics such as response time, success rate, and error count. You define alert rules that evaluate these metrics against thresholds you set, and ARMS sends notifications through SMS, email, DingTalk, Lark, or WeCom when a threshold is breached.
How it works
ARMS continuously collects metrics from your connected application.
Alert rules evaluate metrics against the conditions you define -- for example, average response time >= 500 ms over the last 3 minutes.
When a condition is met, ARMS triggers an alert.
A notification policy routes the alert to your configured channels.
Prerequisites
Before you begin, make sure that you have:
An application connected to ARMS Application Monitoring. For more information, see Application Monitoring overview
Sample scenario
A Java application named user-service runs in a Container Service for Kubernetes (ACK) cluster and is connected to ARMS. To detect performance issues early, create two alert rules:
| Alert rule | Condition | Purpose |
|---|---|---|
| Response time alert | Average response time of dependent service calls >= 500 ms over the last 3 minutes | Detect slow responses before they affect users |
| Success rate alert | Success rate of dependent service calls <= 90% over the last 3 minutes | Detect rising error rates early |
Short-lived fluctuations in response time or success rate are normal. The 3-minute evaluation window filters out transient spikes and surfaces only sustained issues. Adjust threshold values and evaluation windows to match your application's baseline performance.
Step 1: Verify the application connection
Confirm that ARMS is receiving data from your application before you create alert rules.
Log on to the ARMS console.
In the left-side navigation pane, choose .
On the Applications page, click the name of your application (in this example, user-service).
In the left-side navigation pane, click Application Overview. Confirm that the page displays metrics such as response time and request count.
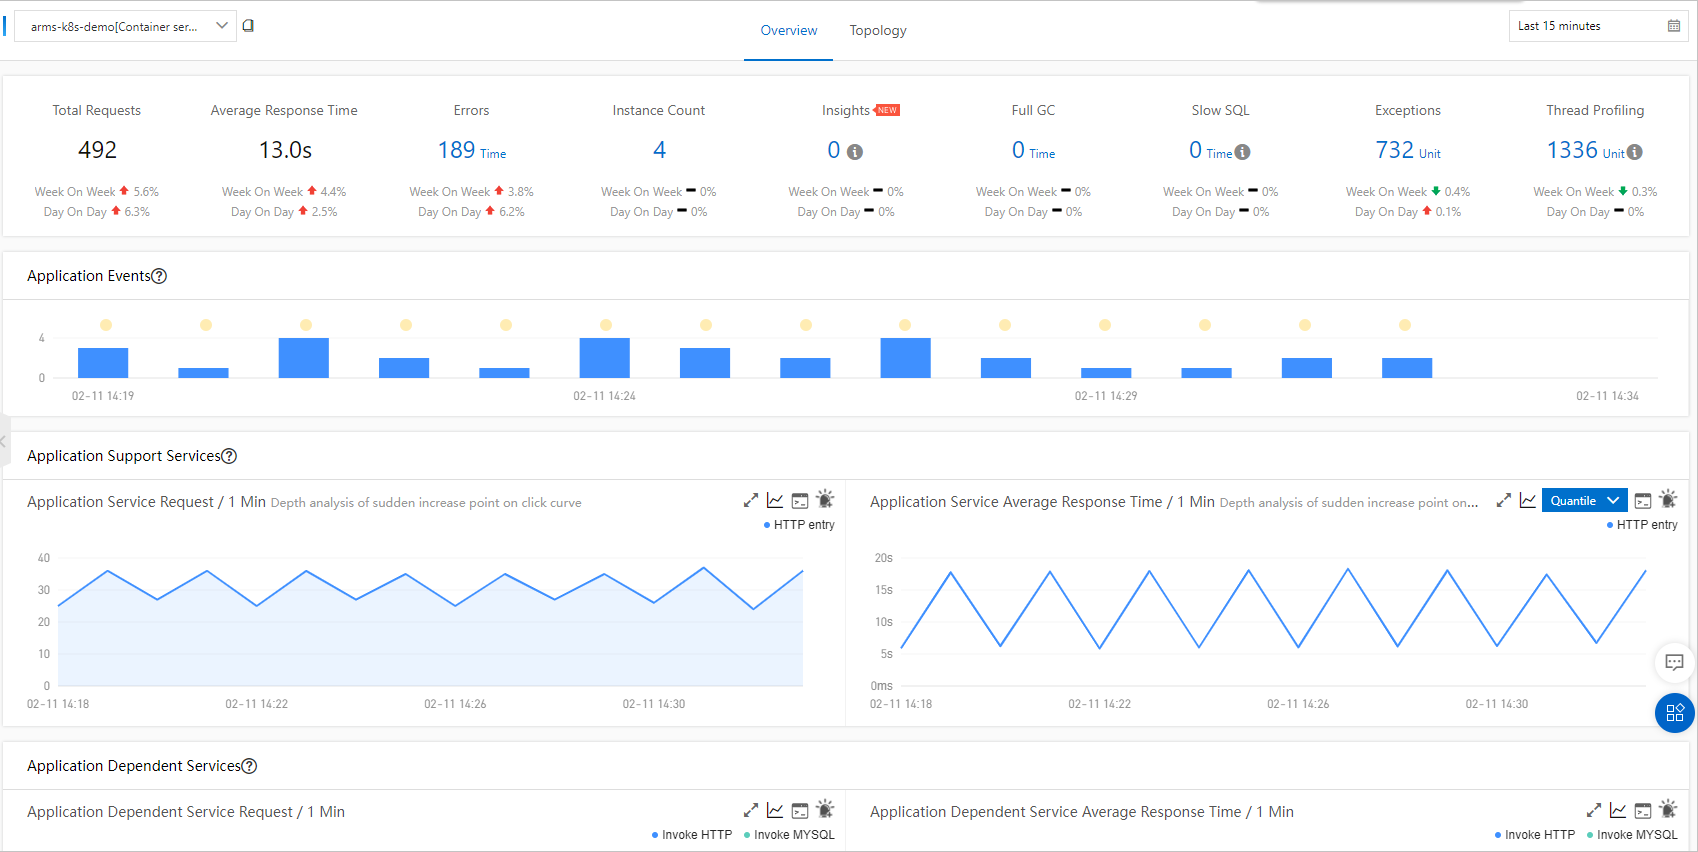
In the left-side navigation pane, click Application Details. On the Overview tab, confirm that metrics data appears.

If data appears on both pages, the application is connected. If no data appears, reconnect the application to ARMS.
The information displayed varies by application type.
Step 2: Open the alert rule creation page
Use one of the following methods to open the Create Application Monitoring Alert Rule page.
From the application overview (recommended)
This method auto-populates the application name and metric type.
Log on to the ARMS console.
In the left-side navigation pane, choose .
In the top navigation bar, select a region.
On the Applications page, click the name of your application.
On the Application Overview page, find the Application Support Services section. Click the Create an alert icon in the upper-right corner of any trend chart.
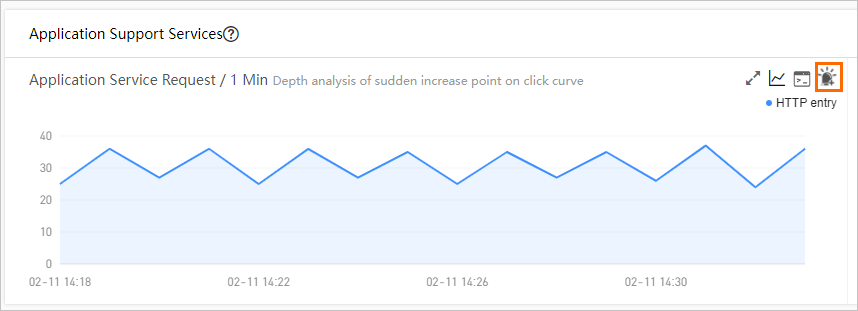
The Create Application Monitoring Alert Rule page opens with the application and metric type pre-filled.
From the alert rules list
Log on to the ARMS console.
In the left-side navigation pane, choose Application Monitoring > Application Monitoring Alert Rules.
In the top navigation bar, select a region.
In the upper-right corner of the Application Monitoring Alert Rule page, click Create Application Monitoring Alert Rule.
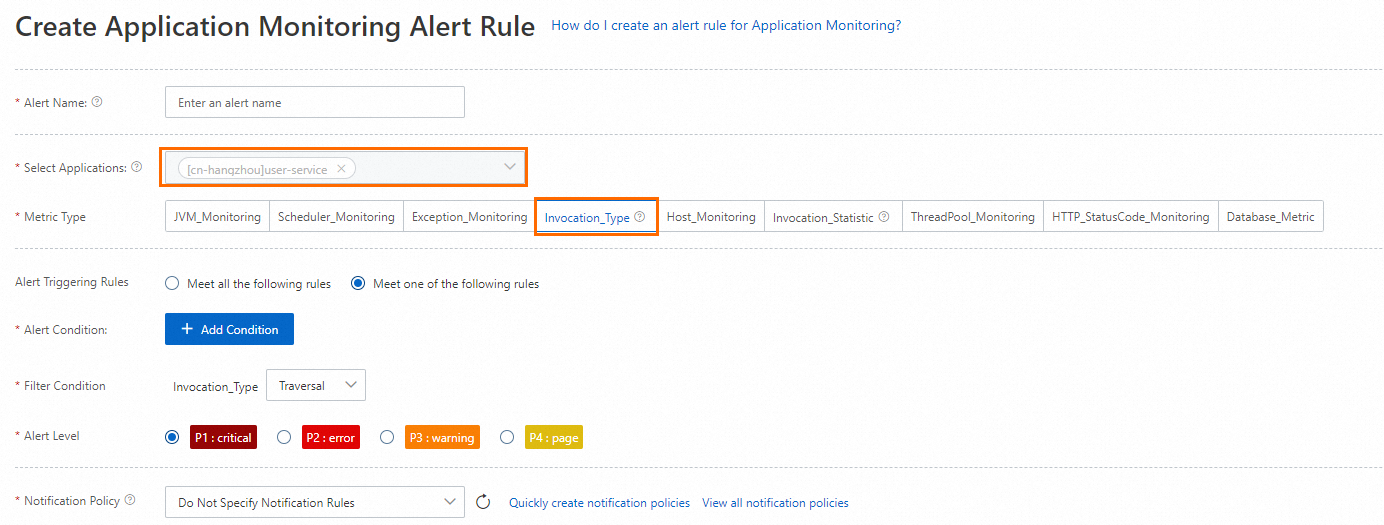
Set Select Applications to your application name and Metric Type to Invocation_Type.
Step 3: Create the alert rules
Create two alert rules -- one for response time and one for success rate. Both rules send notifications through SMS, email, and DingTalk group messages.
Create the response time alert rule
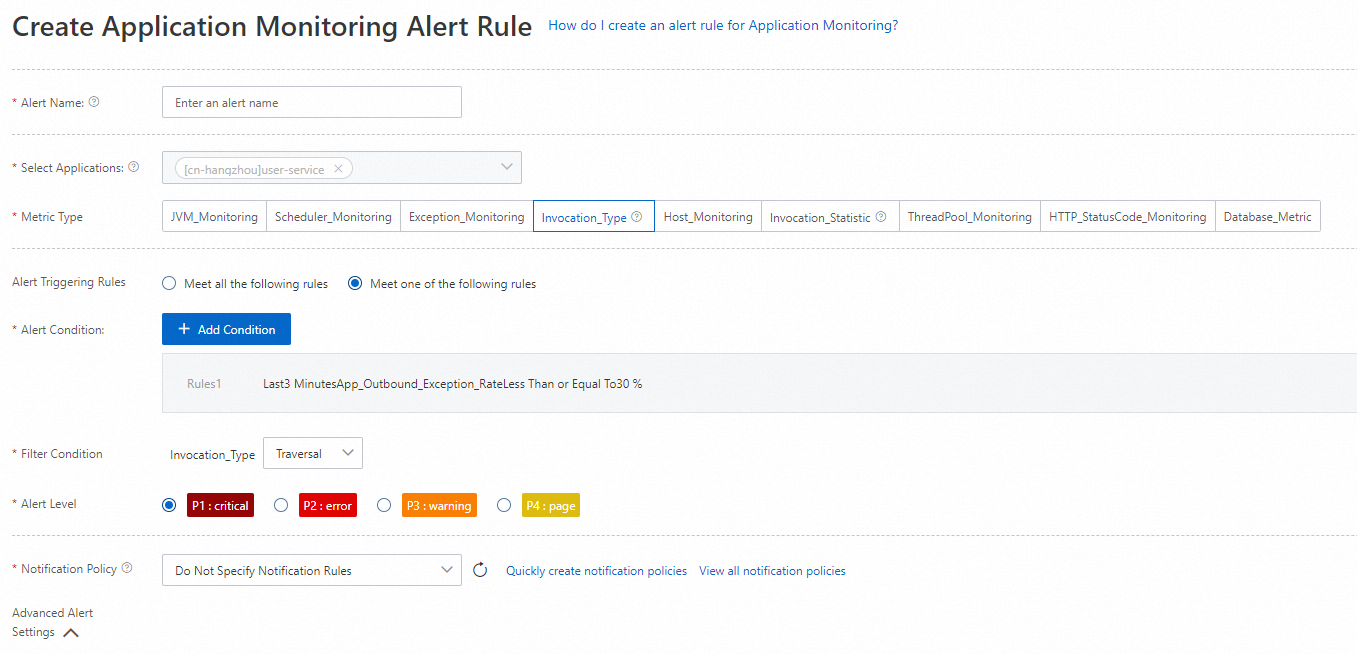
On the Create Application Monitoring Alert Rule page, enter a name for the alert rule and specify the conditions that trigger an alert.
Configure the alert condition: trigger an alert when the average response time of dependent service calls is greater than or equal to 500 ms over the last 3 minutes.

In the Notification Policy drop-down list, select an existing notification policy.
If no notification policy exists, go to step 4 to create one. After you create the policy, click the refresh icon next to Notification Policy and select the new policy.
(Optional) Click Quickly create notification policies next to the Notification Policy drop-down list.
In the panel that appears, select a notification object and configure the remaining parameters.
If no notification object exists, click create a notification object, then click Create a notification object below the drop-down list. The Notifications Objects page opens.
On this page, create the notification objects you need:
On the Contacts tab, click Create Contact. In the Create Contact dialog box, enter the contact details and click OK.
On the Contacts tab, click Create Contact Group. In the Create Contact Group dialog box, enter a group name, add the contact, and click OK.
On the DingTalk /Lark/WeCom tab, click DingTalk. In the Create DingTalk Chatbot panel, configure the chatbot and click OK.
Click Confirm to save the notification policy.
Click Save.
Create the success rate alert rule
Repeat the steps above with the following differences:
Alert condition: Trigger an alert when the success rate of dependent service calls is less than or equal to 90% over the last 3 minutes.
Verify the alert rules
After you create both rules, navigate to Application Monitoring > Application Monitoring Alert Rules to confirm they appear in the list.
View alert notification history
After alert rules take effect, you can review notification history in the ARMS console.
Log on to the ARMS console.
Open the details page of your application. In the left-side navigation pane, choose Alert Management > Alert Sending History.
On the Alarm page, review the alert notification records and timestamps.
For more information, see View alert notification records.