When an ApsaraMQ for RocketMQ instance triggers a message accumulation alert, the Real-time Accumulated Messages value on the Group Details page is higher than expected. On the Message Tracing page, messages appear as published to the broker but not delivered to consumers.
Follow the steps below to identify the root cause and resolve the accumulation.
Why messages accumulate
After messages are sent to a broker, the consumer client pulls them based on its consumer offset. Accumulation occurs when the client cannot consume messages fast enough. Two common causes:
Long consumption time -- Business logic in the consumption thread takes too long per message.
Low thread concurrency -- Too few consumption threads run to keep up with the incoming message rate.
For more information, see Message accumulation and latency.
Troubleshooting
Step 1: Determine where messages accumulate
Check the client's ons.log file for the following message:
the cached message count exceeds the thresholdLog message found -- The client-side buffer queue is full. Messages accumulate on the client. Go to Step 2.
Log message not found -- Messages do not accumulate on the client. Contact Alibaba Cloud technical support.
Step 2: Check the message consumption time
If the consumption time per message is abnormally high, the root cause likely resides in the business logic. Go to Step 3 to inspect the thread stack.
If the consumption time is normal, low thread concurrency causes the accumulation. To resolve this:
Increase the number of consumption threads.
Add consumer nodes to scale out.
Find the consumption time
Use one of the following methods:
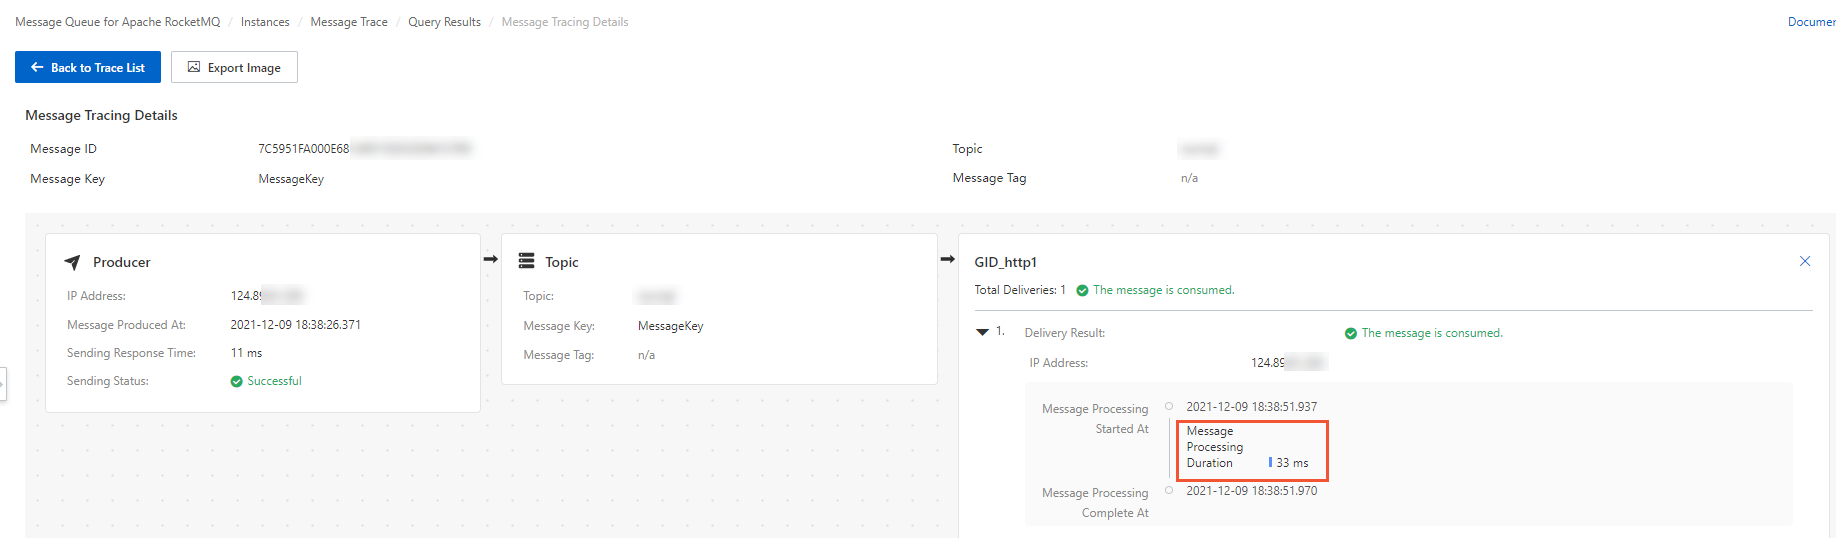
Message trace -- Log on to the ApsaraMQ for RocketMQ console, open the Message Tracing page, and click Create Query Task. Select Query by Message ID and locate the message. In the Consumer section, check the Consumption Duration value. For more information, see Query message traces.
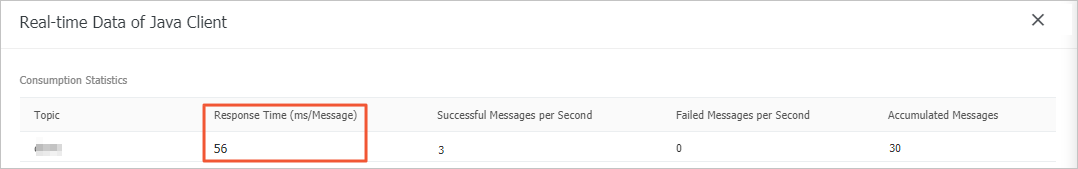
Group details -- On the Group Details page, locate the Client Connection Information section. Click More in the Actions column for the target client. The Response Time (ms/Message) field shows the average consumption time per message. For more information, see View consumer details.
Monitoring service -- Use Application Real-Time Monitoring Service (ARMS) or another monitoring solution to collect consumption time metrics.
Step 3: Inspect the ConsumeMessageThread stack
The ConsumeMessageThread thread contains the message consumption logic. Inspect its stack to identify bottlenecks such as blocked calls, excessive sleeps, or slow external I/O.
For guidance on interpreting thread states, see the Java Thread.State documentation.
Get the thread stack
Option A: ApsaraMQ for RocketMQ console
On the Group Details page, locate the Client Connection section. Click View Stack Information in the Actions column for the target client. For more information, see View consumer details.
Option B: jstack on the host
Log on to the host that runs the consumer instance with accumulated messages. To find the host IP, see View the status of consumers.
Find the Java process ID:
   ps -ef | grep java
   jps -lm
Dump the thread stack:
jstack -l <pid> > /tmp/<pid>.jstackFilter for the
ConsumeMessageThreadentries:cat /tmp/<pid>.jstack | grep ConsumeMessageThread -A 10 --color
Common stack patterns
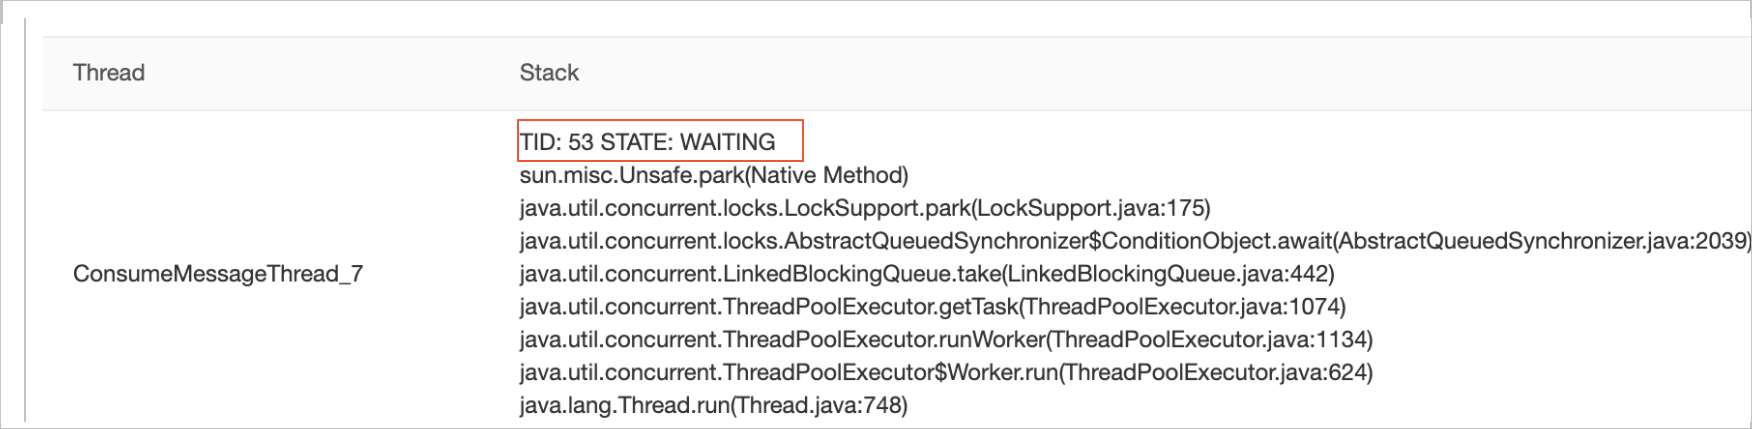
Idle thread (no accumulation)
The consumption thread is in the WAITING state, waiting to pull messages from the client-side buffer queue. This is normal when there are no messages to consume.
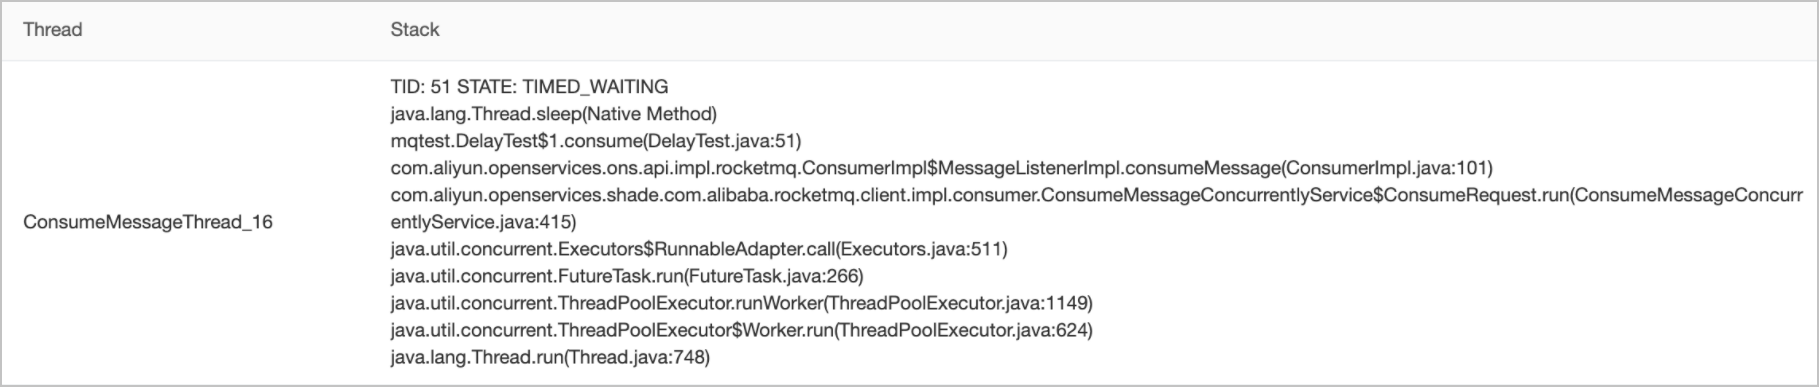
Thread blocked by sleep or lock contention
The consumption thread is blocked in a sleep() call, which slows consumption.
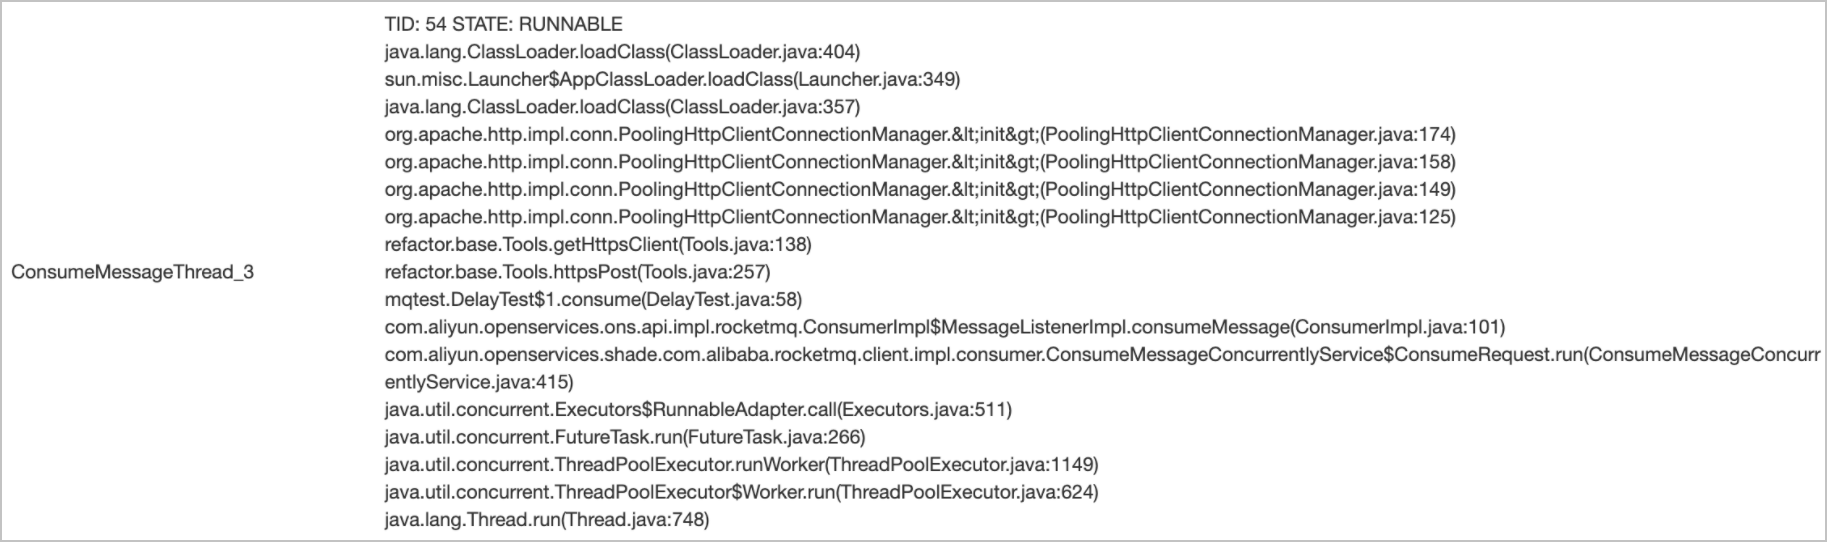
Thread blocked by external I/O
The consumption thread is blocked by an external HTTP call or database operation, which slows consumption.
Step 4: Skip accumulated messages (optional)
If the accumulated messages are no longer relevant and can be safely skipped, reset the consumer offset to the latest position. The consumer then starts consuming from the most recent messages and skips the backlog.
For instructions, see Reset consumer offsets.
Resetting the consumer offset skips all accumulated messages. Verify that these messages are no longer needed before you proceed.
What's next
Message accumulation and latency -- Consumption mechanism and root causes of accumulation.
View consumer details -- Consumer status, connection information, and stack traces.
Reset consumer offsets -- Skip accumulated messages by resetting to the latest offset.