ApsaraMQ for RabbitMQ integrates with Managed Service for Prometheus and Managed Service for Grafana of Application Real-Time Monitoring Service (ARMS) to provide a dashboard feature. This feature uses Managed Service for Prometheus to monitor metrics and Managed Service for Grafana to store and display them. You can use the dashboard to view various metrics for Enterprise Edition and Platinum Edition instances, vhosts, queues, and exchanges. This lets you troubleshoot issues as soon as they arise. This topic describes the metrics available on the dashboard and explains how to use them.
Billing
Metrics displayed on the dashboard of ApsaraMQ for RabbitMQ are basic metrics in Managed Service for Prometheus. You are not charged for these basic metrics. Therefore, the dashboard feature of ApsaraMQ for RabbitMQ is free to use. For more information, see Metrics and Pay-as-you-go.
Limits
The dashboard is supported for Serverless instances, and for subscription Enterprise and Platinum Edition instances. It is not supported for subscription Professional Edition instances.
Service-linked Role
When you view the dashboard, ApsaraMQ for RabbitMQ automatically creates the service-linked role AliyunServiceRoleForAmqpMonitoring.
If the service-linked role does not exist, ApsaraMQ for RabbitMQ automatically creates it. This ensures that you can use the dashboard feature of ApsaraMQ for RabbitMQ as expected.
If the service-linked role already exists, ApsaraMQ for RabbitMQ does not create it again.
For more information about service-linked roles, see Service-linked Role.
Metric details
Overview
The dashboard feature of ApsaraMQ for RabbitMQ provides the following metrics:
Overview: View metrics such as the number of messages, connections, and consumers for an instance or vhost.
Connection: View the number of connections for an instance or vhost.
Exchange: View the number of messages that flow into and out of an exchange.
Queue: View the number of messages, API calls, and consumers for a queue.
Consumer: View the processing results of messages at the consumer.
All metrics are measured in minutes, except for rabbitmq_instance_api_tps_max, which is measured in seconds.
Overview
Metric type | Metric name | Unit | Description | Label |
gauge | rabbitmq_instance_api_tps_max | count/s | The maximum transactions per second (TPS) for API calls to the instance within one minute. Rule: The system samples the TPS once per second over a 1-minute period and uses the maximum value from the 60 samples. | {tenant_userid, instanceId} |
counter | rabbitmq_connections_opened_total | count | Number of opened connections. | {tenant_userid,instanceId,vHost} |
counter | rabbitmq_connections_closed_total | count | Number of closed connections. | {tenant_userid,instanceId,vHost} |
counter | rabbitmq_channels_opened_total | count | Number of opened channels. | {tenant_userid,instanceId,vHost} |
counter | rabbitmq_channels_closed_total | count | Number of closed channels. | {tenant_userid,instanceId,vHost} |
counter | rabbitmq_queues_declared_total | count | Number of created queues. | {tenant_userid,instanceId,vHost} |
counter | rabbitmq_queues_deleted_total | count | Number of deleted queues. | {tenant_userid,instanceId,vHost} |
counter | rabbitmq_exchange_declared_total | count | Number of created exchanges. | {tenant_userid,instanceId,vHost} |
counter | rabbitmq_exchange_deleted_total | count | Number of deleted exchanges. | {tenant_userid,instanceId,vHost} |
counter | rabbitmq_exchange_bind_total | count | Number of bindings added to the exchange. | {tenant_userid,instanceId,vHost} |
counter | rabbitmq_exchange_unbind_total | count | Number of bindings removed from the exchange. | {tenant_userid,instanceId,vHost} |
counter | rabbitmq_queue_bind_total | count | Number of bindings added to the queue. | {tenant_userid,instanceId,vHost} |
counter | rabbitmq_queue_unbind_total | count | Number of bindings removed from the queue. | {tenant_userid,instanceId,vHost} |
gauge | rabbitmq_connections | count | Total number of currently open connections. | {tenant_userid,instanceId,vHost} |
gauge | rabbitmq_channels | count | Total number of currently open channels. | {tenant_userid,instanceId,vHost} |
Connections
Metric type | Metric name | Unit | Description | Label |
gauge | rabbitmq_connection_channels | count | Number of channels on the connection. | {tenant_userid,instanceId,vHost,remoteAddress} |
Exchange
Metric type | Metric name | Unit | Description | Label |
counter | rabbitmq_exchange_messages_published_in_total | count | Number of messages that flow into the exchange. | {tenant_userid,instanceId,vHost,exchangeName} |
counter | rabbitmq_exchange_messages_published_out_total | count | Number of messages that flow out of the exchange. | {tenant_userid,instanceId,vHost,exchangeName} |
Queue
Metric type | Metric name | Unit | Description | Label |
counter | rabbitmq_queue_messages_published_total | count | Number of messages sent to the queue. | {tenant_userid,instanceId,vHost,queueName} |
gauge | rabbitmq_queue_messages_ready | count | Number of ready messages in the queue that can be delivered to consumers. | {tenant_userid,instanceId,vHost,queueName} |
gauge | rabbitmq_queue_messages_timing | count | Number of scheduled messages in the queue. | {tenant_userid,instanceId,vHost,queueName} |
gauge | rabbitmq_queue_messages_unacked | count | Number of messages in the queue that are being processed and for which no ACK responses are returned. | {tenant_userid,instanceId,vHost,queueName} |
counter | rabbitmq_queue_deliver_total | count | Number of times the BasicConsume API is called. | {tenant_userid,instanceId,vHost,queueName} |
counter | rabbitmq_queue_get_total | count | Number of times the BasicGet API is called. | {tenant_userid,instanceId,vHost,queueName} |
counter | rabbitmq_queue_ack_total | count | Number of times the BasicAck API is called. | {tenant_userid,instanceId,vHost,queueName} |
counter | rabbitmq_queue_uack_total | count | Number of times the BasicNack API is called. | {tenant_userid,instanceId,vHost,queueName} |
counter | rabbitmq_queue_recover_total | count | Number of times the BasicRecover API is called. | {tenant_userid,instanceId,vHost,queueName} |
counter | rabbitmq_queue_reject_total | count | Number of times the BasicReject API is called. | {tenant_userid,instanceId,vHost,queueName} |
gauge | rabbitmq_queue_consumers | count | Total number of consumers for the queue. | {tenant_userid,instanceId,vHost,queueName} |
Consumer
Metric type | Metric name | Unit | Description | Label |
gauge | rabbitmq_consumer_acked_process_time_avg | count | Average processing time for messages for which responses are returned. | {tenant_userid,instanceId,vHost,queueName,remoteAddress,ackType} |
gauge | rabbitmq_consumer_unacked_process_time_avg | count | Average processing time for messages for which no responses are returned. | {tenant_userid,instanceId,vHost,queueName,remoteAddress,ackType} |
gauge | rabbitmq_consumer_acked_messages | count | Number of messages for which responses are returned. | {tenant_userid,instanceId,vHost,queueName,remoteAddress,ackType} |
gauge | rabbitmq_consumer_unacked_messages | count | Number of messages for which no responses are returned. | {tenant_userid,instanceId,vHost,queueName,remoteAddress} |
Metric type descriptions
The metrics defined in ApsaraMQ for RabbitMQ are fully compatible with the open source Prometheus standard. The metric types include counter and gauge.
counter: A cumulative metric whose value only increases. For example, the number of API calls.
gauge: A metric whose value can increase or decrease. It represents the instantaneous value of a statistical object. For example, the TPS for API calls.
Label descriptions
The following describes the labels for metrics in ApsaraMQ for RabbitMQ:
tenant_userid: The ID of your Alibaba Cloud account.
instanceId: The ID of the ApsaraMQ for RabbitMQ instance.
vHost: The name of the vHost on the ApsaraMQ for RabbitMQ instance.
remoteAddress: The IP address of the ApsaraMQ for RabbitMQ client.
Exchange: The name of the exchange on the ApsaraMQ for RabbitMQ instance.
queueName: The name of the queue on the ApsaraMQ for RabbitMQ instance.
ackType: The response result from the client after it processes a message.
View the dashboard
Prerequisites
An ApsaraMQ for RabbitMQ instance is created. For more information, see Manage instances.
A vhost, a queue, and an exchange are created and available on the ApsaraMQ for RabbitMQ instance. For more information, see Manage vhosts, Manage exchanges, and Manage queues.
Application Real-Time Monitoring Service (ARMS) is activated. For more information, see Activate Managed Service for Prometheus.
Procedure
Log on to the ApsaraMQ for RabbitMQ console. In the left-side navigation pane, click Instances.
In the top navigation bar of the Instances page, select the region where the instance that you want to manage resides. Then, in the instance list, click the name of the instance that you want to manage.
In the navigation pane on the left, click Dashboard. On the Dashboard page, you can view the dashboard.
You can specify a Vhost, an Exchange, a Queue, and a time range to view the dashboard based on your requirements.
Filter by Vhost, Exchange, or Queue: On the Dashboard page, click the Vhost, Exchange, or Queue drop-down list and enter the name of the item that you want to view. If you do not specify a value, the metrics for all vhosts, exchanges, and queues in the instance are displayed by default.

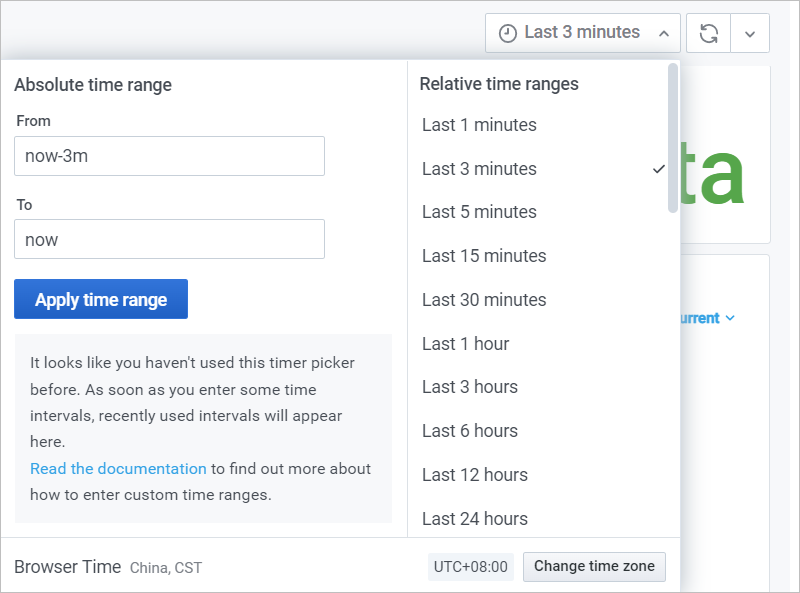
Specify a time range: In the upper-right corner of the Dashboard page, click the time picker. In the drop-down list that appears, you can select a predefined relative time range, such as Last 5 minutes, Last 12 hours, or Last 30 days. You can also specify a custom absolute time range by setting the start and end times.

After the settings are configured, you can view the metrics for the specified vhost, exchange, queue, or time range on the Dashboard page. For a description of the metrics, see Metric details.
Obtain metric data from the dashboard
All metrics on the dashboard are stored in Managed Service for Prometheus under your Alibaba Cloud account. To query the data, perform the following steps:
Log on to the ARMS console. In the navigation pane on the left, click Integration Center.
On the Integration Center page, enter
RabbitMQin the search box and click the icon.
icon.In the search results, select the cloud service whose monitoring data you want to integrate, such as Alibaba Cloud RabbitMQ Enterprise Edition. For detailed instructions, see Step 1: Integrate cloud service monitoring data.
After you integrate the monitoring data of the cloud service into ARMS, click Integration Management in the navigation pane on the left.
On the Connected Environments tab, in the Cloud Service Region Environments list, click the name of the target environment to open its details page.
In the Basic Information section of the Component Management tab, click the cloud service region next to Prometheus Instance.
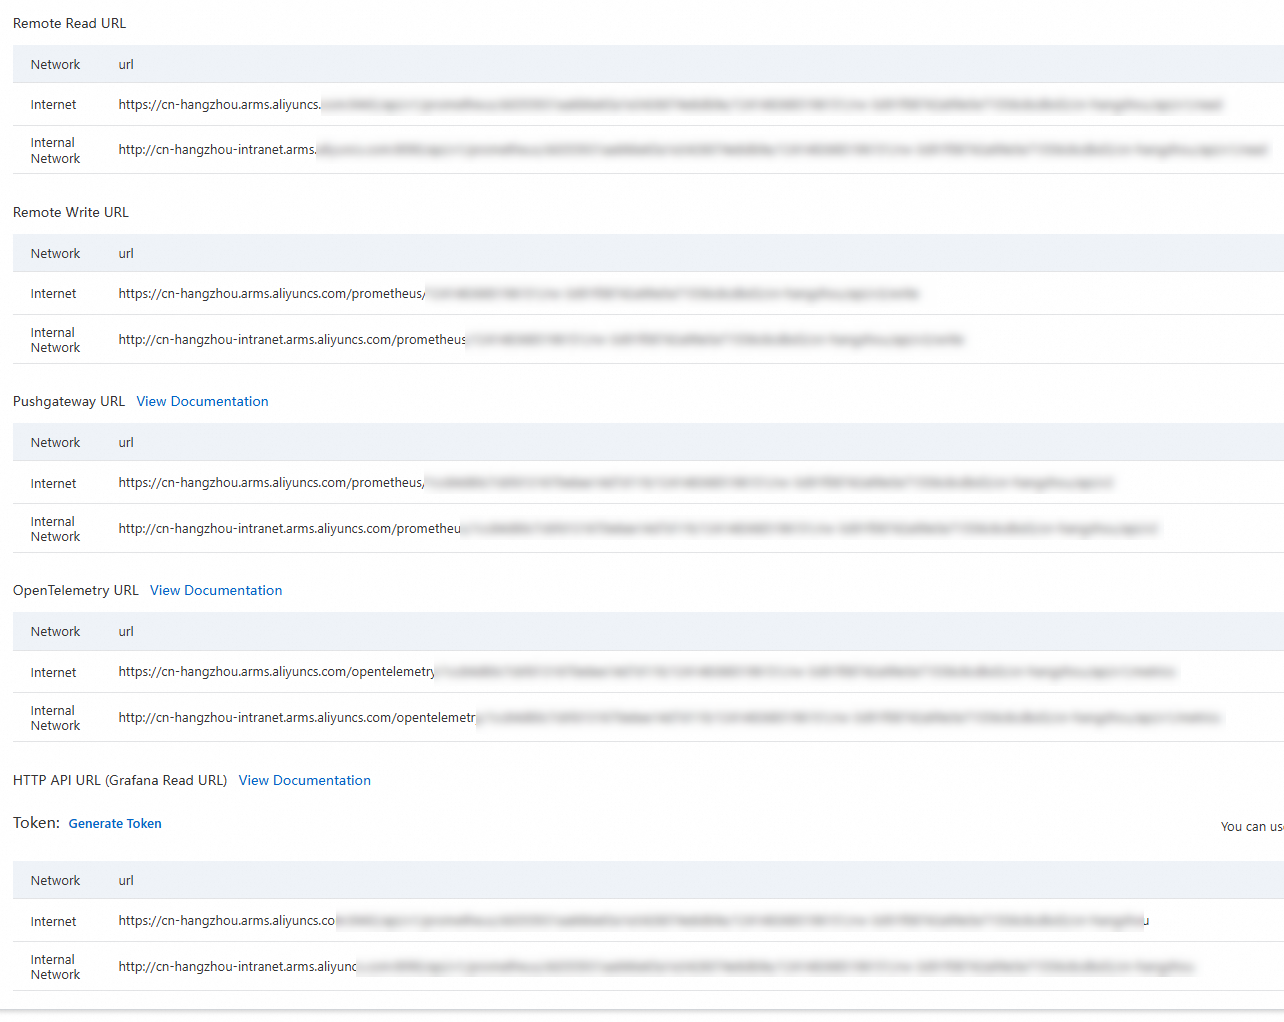
On the Settings tab, you can obtain different data access methods.

Integrate dashboard metric data into a self-managed Grafana
All metric data on the dashboard of ApsaraMQ for RabbitMQ is stored in your Alibaba Cloud Managed Service for Prometheus. You can follow the steps in How do I obtain metrics on the dashboard? to connect to the Alibaba Cloud service and retrieve the environment name and HTTP API URL. You can then use the API to integrate the metric data from the ApsaraMQ for RabbitMQ dashboard into a self-managed Grafana system. For more information, see Use an HTTP API URL to access Prometheus data in a self-managed Grafana system or a custom application.