This topic describes how to query the peak Transactions Per Second (TPS) for an ApsaraMQ for RabbitMQ instance.
Background information
If the peak TPS of your actual traffic exceeds the TPS limit of your instance, the ApsaraMQ for RabbitMQ instance is throttled.
To prevent business disruptions from throttling, monitor the peak TPS of your instance as a key metric in your daily O&M (Operations and Maintenance) tasks. This practice provides early warnings if you are at risk of exceeding your instance specifications. By observing changes in the peak TPS, you can also understand business fluctuations and determine whether the current instance type meets your business needs.
Query methods
ApsaraMQ for RabbitMQ supports the following methods to query the peak TPS of an instance.
|
Query method |
Description |
Time granularity |
Resource level |
|
(Recommended) Query instance peak TPS and set alerts using Cloud Monitor |
Advantages:
|
Minute-level peak TPS The value is the maximum TPS of the instance per second within a 1-minute epoch. |
Instance-level peak TPS |
|
(Recommended) Query instance peak TPS from the instance details page |
|
Second-level peak TPS |
|
|
Second-level peak TPS |
Instance-level peak TPS |
Query instance peak TPS and set alerts using Cloud Monitor
Query instance peak TPS
Log on to the ApsaraMQ for RabbitMQ console. In the left-side navigation pane, click Instances.
In the top navigation bar of the Instances page, select the region where the instance that you want to manage resides. Then, in the instance list, click the name of the instance that you want to manage.
-
In the navigation pane on the left, click Monitoring and Alerting.
-
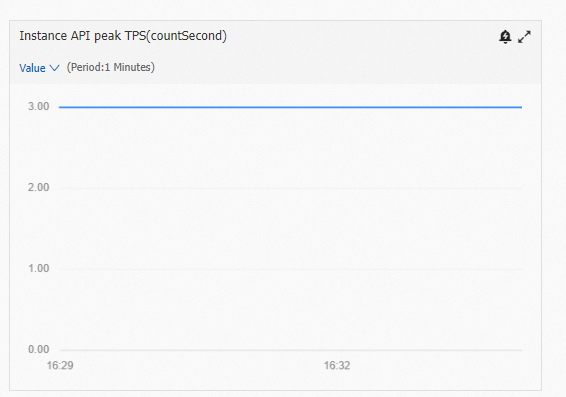
On the Monitoring and Alerting page, select Instance from the Group drop-down list and specify a time range for the query.
The following figure shows an example of how to query the peak TPS of an instance:
Set alerts for API peak TPS
Log on to the ApsaraMQ for RabbitMQ console. In the left-side navigation pane, click Instances.
In the top navigation bar of the Instances page, select the region where the instance that you want to manage resides. Then, in the instance list, click the name of the instance that you want to manage.
-
In the navigation pane on the left, click Monitoring and Alerting.
-
In the upper-right corner of the Monitoring and Alerting page, click Create Alert Rule.
You are redirected to the Create Alert Rule panel in Cloud Monitor.
-
In the Set Rule Description panel, configure the alert rule. From the Monitoring Metric drop-down list, select . For more information, see Alert service.
Query instance peak TPS from the instance details page
Log on to the ApsaraMQ for RabbitMQ console. In the left-side navigation pane, click Instances.
In the top navigation bar of the Instances page, select the region where the instance that you want to manage resides. Then, in the instance list, click the name of the instance that you want to manage.
-
On the Instance Details page, click the Peak TPS Query tab.
NoteYou can use this method to query peak TPS data for the last 15 days. The results are provided at a per-second granularity. To avoid displaying an excessive amount of data, only data from the last 10 minutes is shown.
-
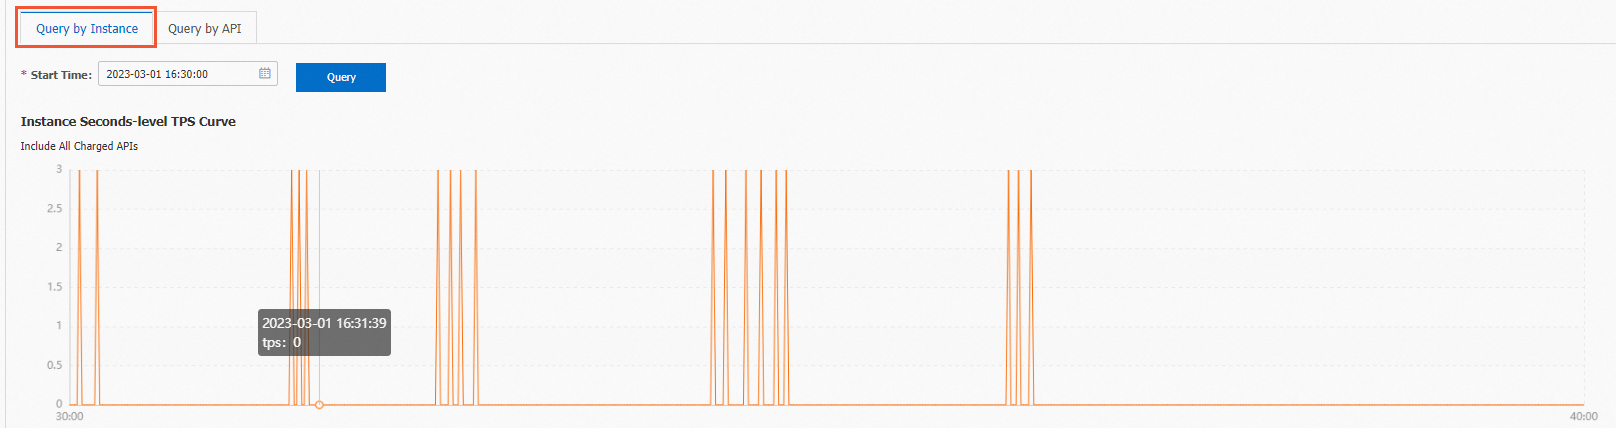
To query the instance-level peak TPS:
Click the Query by Instance tab, select a time range, and then click Query.
-
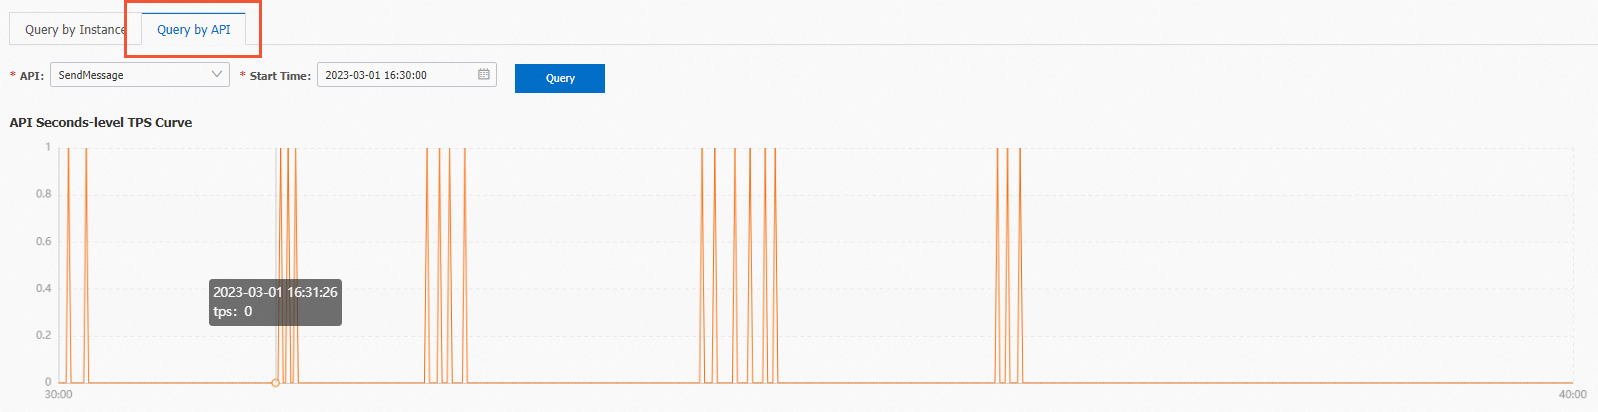
To query the API-level peak TPS:
Click the Query by API tab, select a time range, and then click Query.
-
Query instance peak TPS using log query
For more information, see Quick start for query and analysis.
The following is an example of an analytic statement:
(Action : ConnectionOpen or Action : ChannelOpen or Action: ExchangeDeclare or Action: QueueBind or Action : QueueDeclare or Action : QueueDelete or Action : ExchangeDelete or Action : QueueUnBind or Action : ExchangeBind or Action : ExchangeUnBind or Action : BasicConsume or Action : BasicReject or Action : BasicRecover or Action : SendMessage or Action : BasicAck or Action : BasicNack or Action : BasicGet ) | select from_unixtime(cast(microtime as bigint)/1000/1000) as time, COUNT(*) as count GROUP by time ORDER by time limit 90000000