This topic provides answers to commonly asked questions about metrics in ApsaraMQ for Kafka.
What metrics do I need to monitor?
In most cases, you need to monitor only the following metrics:
Reserved instances
instance_disk_capacity(%)
InstanceInternetRxUtilizationByNode(%)
InstanceInternetTxUtilizationByNode(%)
Proportion of Production Traffic in Instance Type(%)
Proportion of Consumption Traffic in Instance Type(%)
Proportion of Partitions in Instance Type(%)
Serverless instances
InstanceMessageInputRatioV3(%)
InstanceMessageOutputRatioV3(%)
InstanceMaxNodeInputRatioV3(%)
InstanceMaxNodeOutputRatioV3(%)
Why are the values of specific metrics inaccurate?
Inaccuracies in metric values may be caused by one of the following reasons:
Your business traffic is low. The system calculates the value of each metric based on a specific formula. If business traffic is low, the deviation in the calculation result is large.
The version of your client is outdated. Earlier versions of the client do not pass the corresponding parameters. This results in deviations in monitoring data. We recommend that you upgrade your client to the latest version.
Data is compressed. Producers compress data to meet specific transmission or storage requirements. This results in deviations in monitoring data.
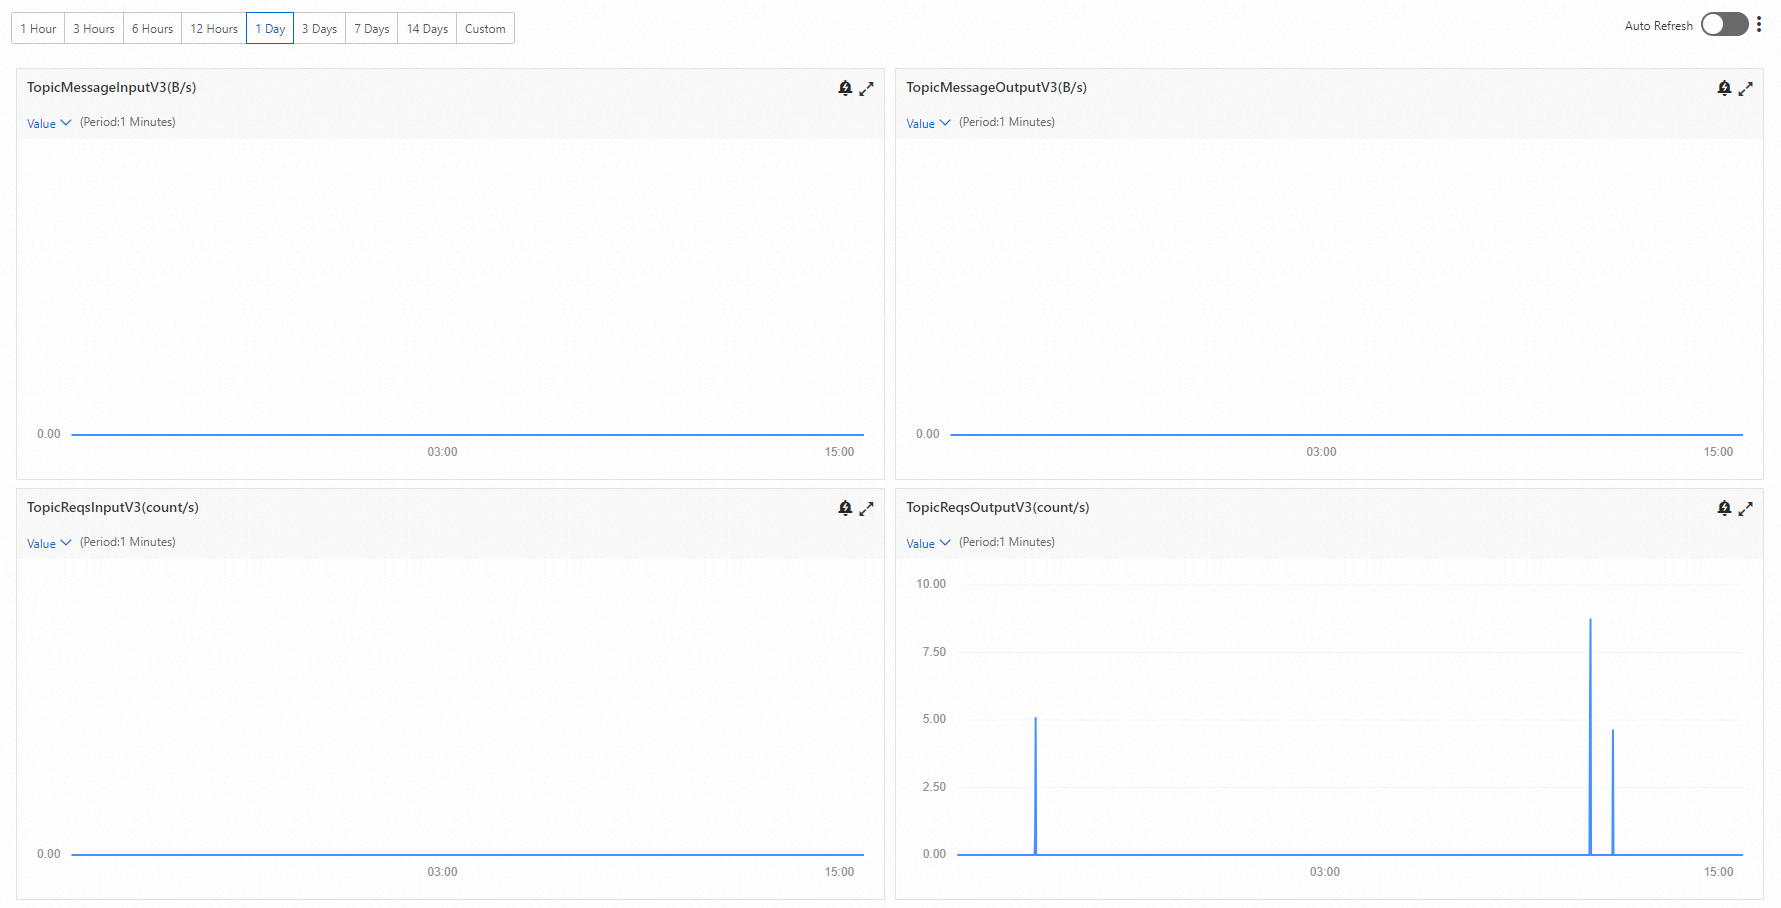
Why is the value of the InstanceMessageOutput or TopicMessageOutput metric 0 when the value of the InstanceReqsOutput or TopicReqsOutput metric is greater than 0?
This issue is not caused by exceptions or errors. This issue occurs because the consumers remain active and attempt to pull messages from the broker when no new messages are published to the broker. As a result, the number of consumed messages is 0 and the number of message consumption attempts increases.