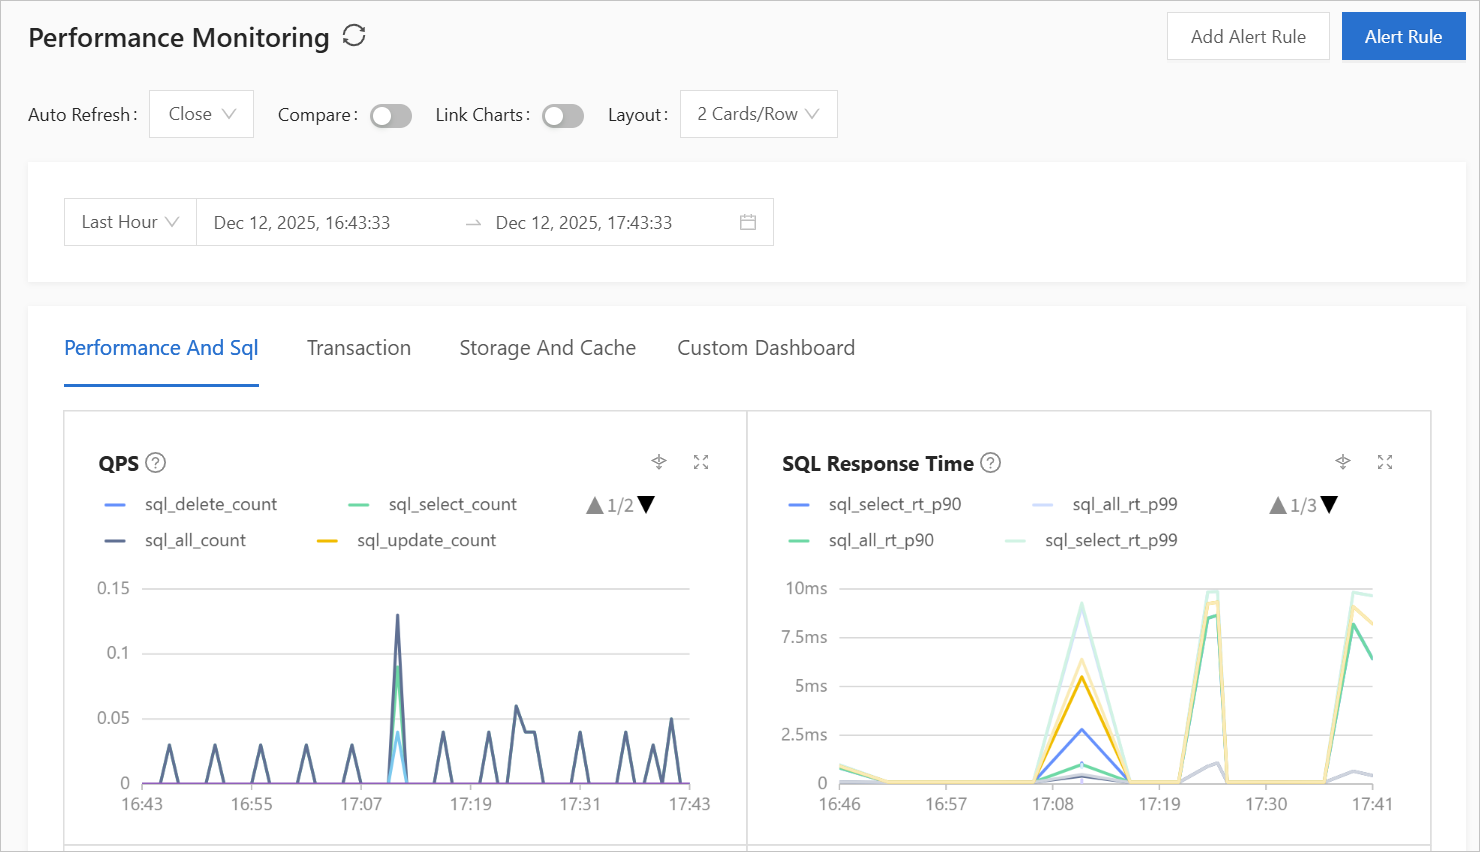
On the transaction details page, you can view the monitoring data related to transaction processing.
View transaction monitoring data
By default, the Transaction tab displays the number of processed transactions, average transaction execution time, and transaction log information in the last hour.

The following table describes the performance metrics.
You can click the question mark (?) next to a monitoring metric to view its details.
Monitoring item | Metric | Unit | Description |
TPS | Times/s | The number of a specific type of transactions committed per second | |
Transaction Response Time | μs | The average processing time of each transaction on the server. | |
Transactions Logged per Second | trans_commit_log_count | Times/s | The number of transaction logs committed per second in the tenant. |
Transaction Log Size | clog_trans_log_total_size | GiB | The total size of transaction logs committed per second in the tenant. |
Transaction Lock Waits per Second | Times/s | The number of successful or failed transaction lock waits per second in the tenant. | |
Average Wait Time per Lock | memstore_write_lock_wait_time | μs | The average wait time for each lock in the tenant. |
Transaction Count | Times/s | The number of distributed or regular transactions per second in the tenant. | |
Average Time for Network Synchronization of Transaction Logs per Transaction | trans_commit_log_sync_rt | ms | The average amount of time consumed on each synchronization of transaction logs over the network. |