On the performance and SQL monitoring details page of a tenant, you can view basic information about the tenant and the monitoring data such as SQL execution status.
View performance and SQL monitoring data
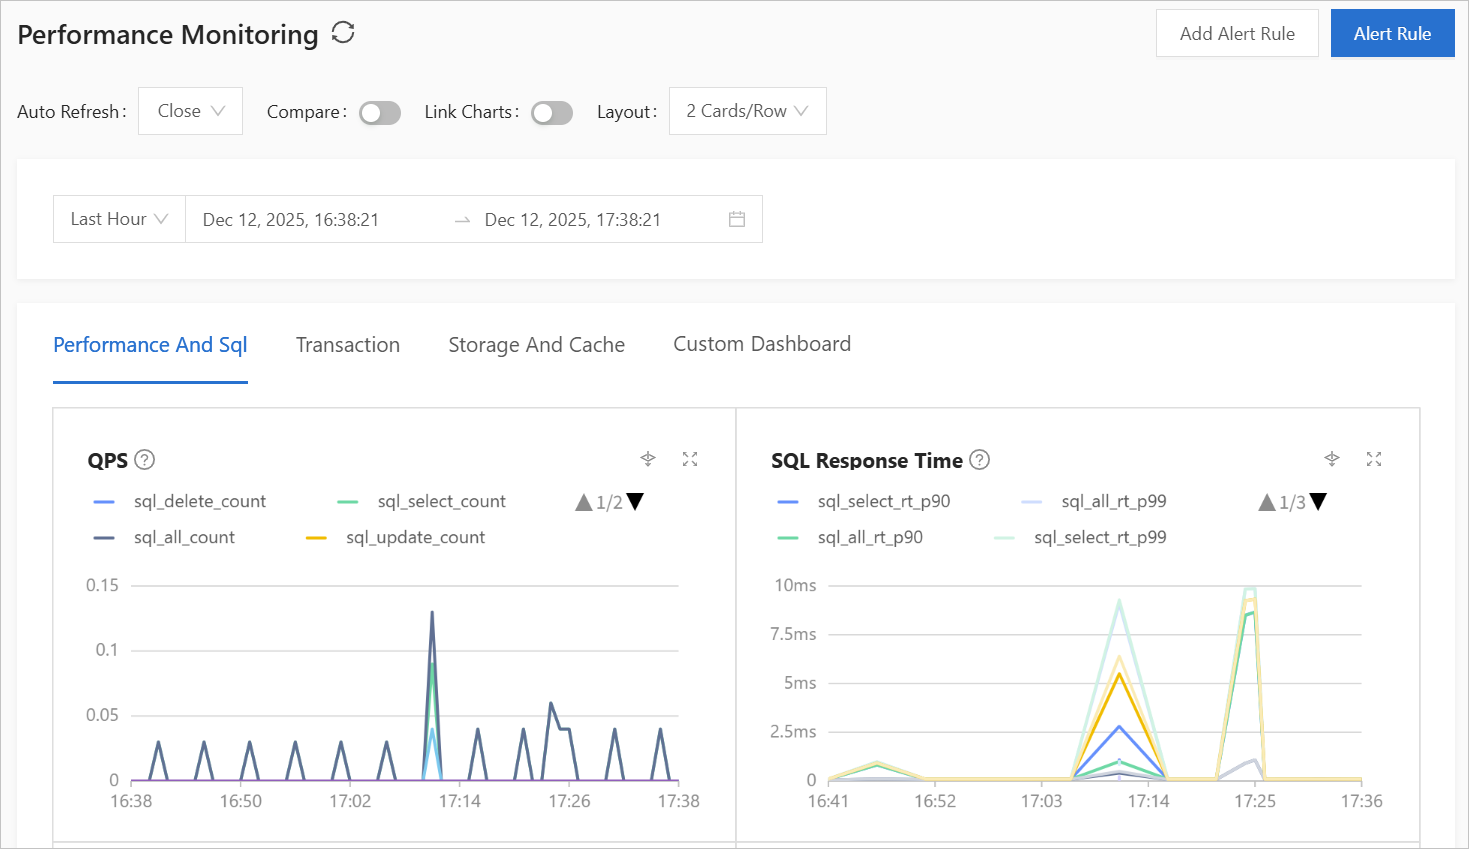
By default, the Performance and SQL tab displays the number of sessions and the execution frequency and response time of general SQL statements in the last hour. You can specify a time period or click fields in a chart to filter the data to view.
The following table describes the performance metrics.
You can click the question mark (?) next to a monitoring metric to view its details.
Monitoring item | Metric | Unit | Description |
QPS |
| Times/s | The number of a specific type of SQL statements processed per second. |
SQL Response Time |
| μs | The average time consumed in processing a specific type of SQL statements, and the average time consumed in processing SQL statements at the 99th percentile. |
TPS |
| Times/s | The number of a specific type of transaction operations processed per second in the tenant database. |
Transaction Response Time | transaction_rt: the response time of transactions. transaction_commit_rt: the average time consumed in committing a transaction. transaction_rollback_rt: the average time consumed in rolling back a transaction. | μs | The average time consumed in processing a specific type of transaction operations. |
Number of Sessions |
| Sessions | The number of all or active sessions in the tenant database. |
Number of SQL Execution Plans |
| Times/s | The number of executions of a specific type of execution plans. |
Events Waited per Second |
| Times/s | The number of a specific type of wait events per second. |
Average Wait Time per Event | μs | The average wait time of a specific type of wait events. | |
Requests Enqueued and Dequeued per Second | Times/s | The number of requests entering or exiting the queue per second. | |
SQL Request Queue Time | request_queue_time | μs | The time consumed by an SQL statement waiting in a queue. |
CPU Utilization of Tenant | ob_cpu_percent | % | The CPU utilization of the tenant. |
Memory Usage of OceanBase Tenant | ob_tenant_memory_percent | % | The memory usage of the tenant. |
MemStore Usage | memstore_percent | % | The MemStore usage of the tenant. |
RPC Packet Transmission Time | μs | The average time consumed in sending or receiving an RPC packet. | |
RPC packet throughput per unit time | KiB | The data amount of RPC packets that are sent and received per unit time. | |
Open Cursor Count | opened_cursors_count | N/A | The number of open cursors. |
Slow SQL Statements | slow_sql_count | N/A | The number of slow SQL statements. |
Database Work Time |
| s |
|
Database Non-idle Waiting Time |
| s |
|
Wait Events |
| Events |
|
Execution Events in Specific State in Database |
| Events |
|
Ob Clog Replayed Scn | ob_clog_ls_max_replayed_scn | ms | The replica latency. |