This topic describes how to use the drill-down monitoring feature on the cluster performance monitoring page.
Background information
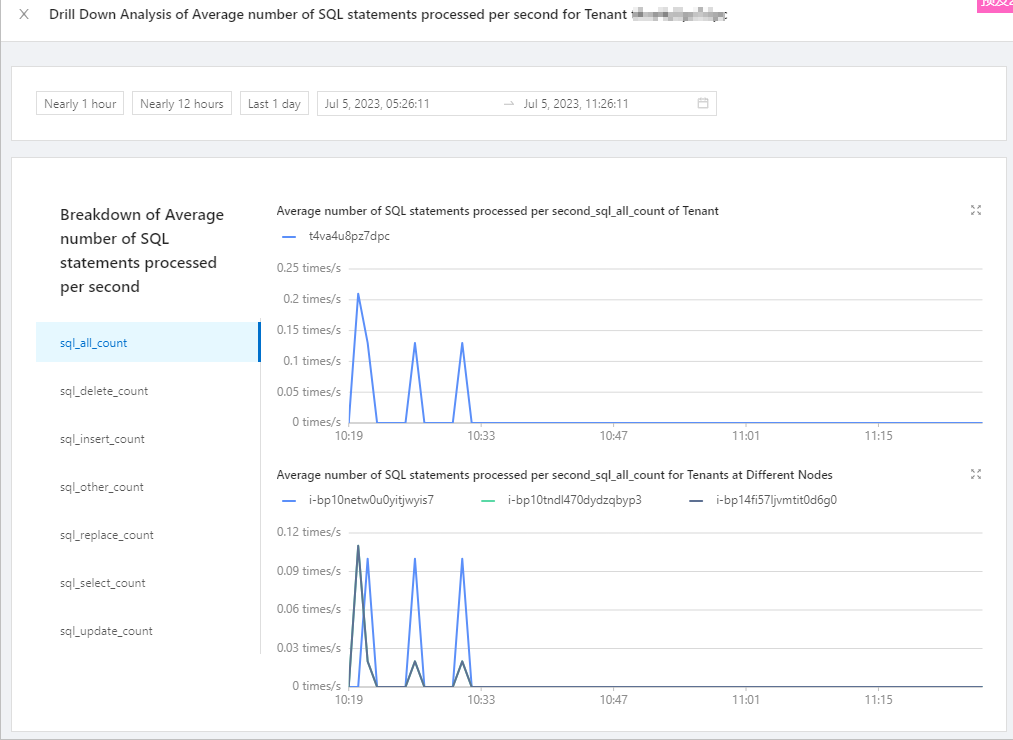
ApsaraDB for OceanBase provides a range of monitoring metrics for cluster instances, tenants, and nodes. The monitoring data of some metrics is correlated between cluster instances, tenants, and nodes. The drill-down monitoring feature presents the data of the same metric from different dimensions. This can help you quickly locate abnormal monitoring metrics and perform routine O&M analysis.
The drill-down dimensions for cluster instances are as follows: cluster instance > tenant > node.
Procedure
Log on to the ApsaraDB for OceanBase console.
In the left-side navigation pane, click Instances.
In the instance list, click the name of the target cluster instance to go to the Cluster Instance Workspace page.
In the left-side navigation pane of the Cluster Instance Workspace page, click Performance Monitoring.
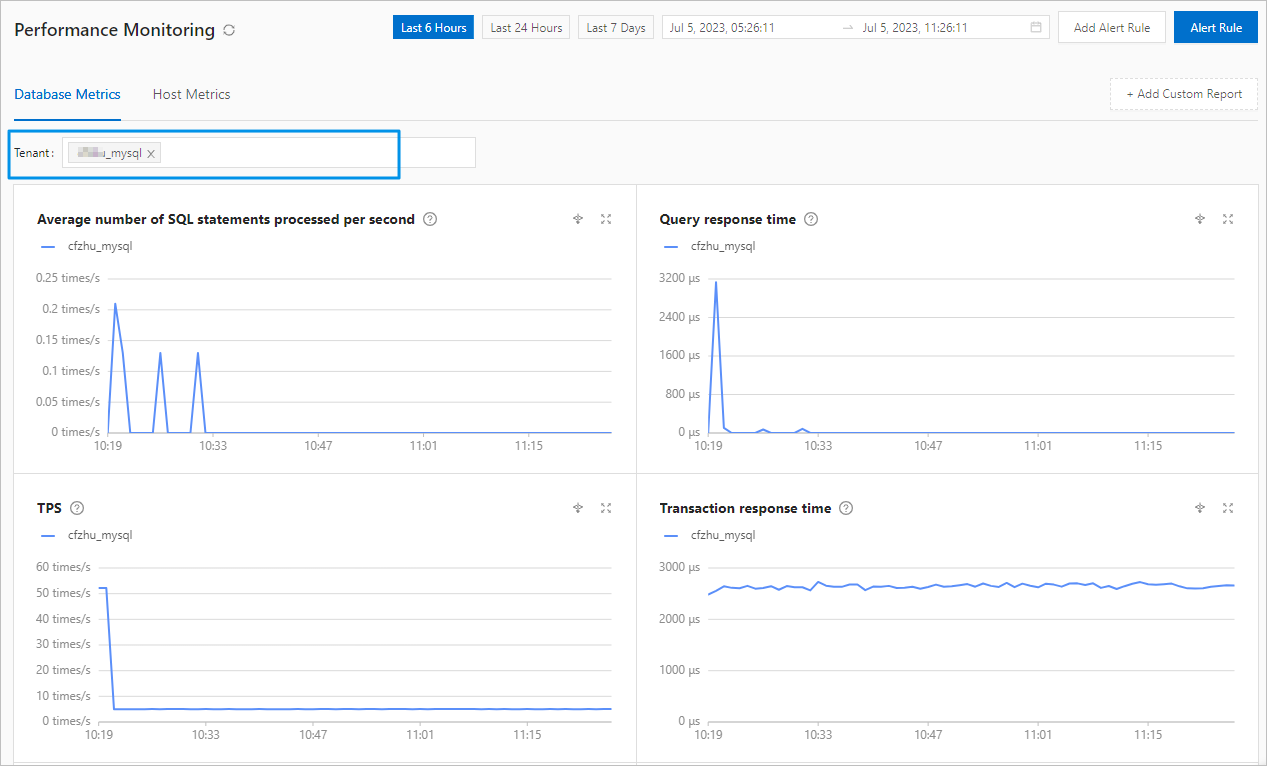
On the page that appears, click the Database Metrics tab or the custom report tab. Then, select the target tenant.

Click the drill-down icon
 next to a monitoring metric to view its sub-metrics.
 Note
NoteAt present, you cannot select multiple tenants for drill-down performance monitoring.