This topic describes how to view the monitoring data of database proxies.
View the monitoring data of database proxies
Log in to the ApsaraDB for OceanBase console.
In the left-side navigation pane, click Instances.
In the instance list, click the name of the target instance to go to the instance workspace.
In the left-side navigation pane of the instance workspace, click Performance Monitoring.
Click the Obproxy Database Performance tab.
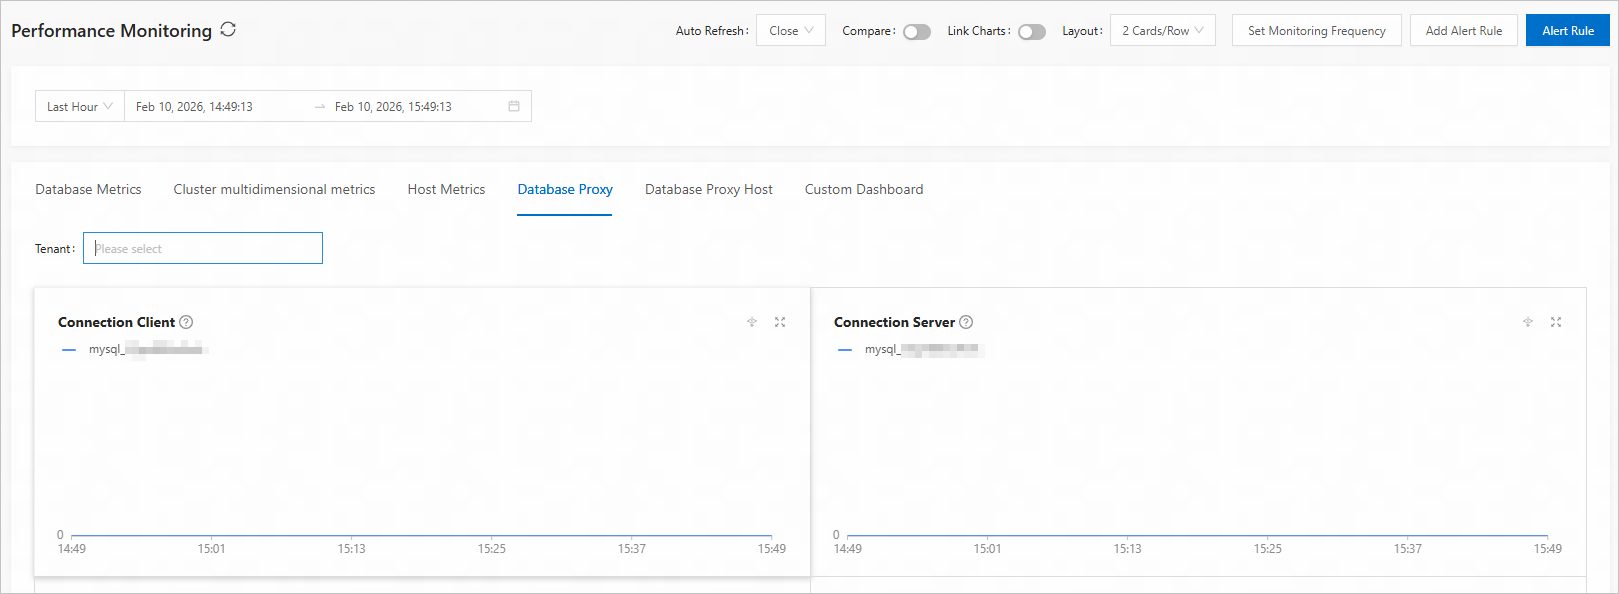
By default, the Proxy Database tab displays the monitoring data of all tenants in the last hour.
You can select a tenant from the Tenant drop-down list to view the monitoring data of the tenant. If you select multiple tenants, you can click a tenant name in the chart to view the monitoring data of the specific tenant.
You can also specify a time period to filter the data to view.
The following table describes the performance metrics.
Monitoring item
Metric
Unit
Description
Client Connections
client_connections
Connections
The number of client connections.
Server Connections
server_connections
Connections
The number of server connections.
QPS
qps
Times/s
The number of queries per second.
Average SQL Statement Processing Time
qps_rt
μs
The average time consumed in processing an SQL statement.
TPS
tps
Times/s
The number of transactions per second.
NoteThe preceding metric names are supported values of the Metrics request parameter of the DescribeMetricsDataV2 operation.