In scenarios involving microservices architectures, we recommend that you use the Microservices Engine (MSE) Ingress for traffic distribution and routing of Knative Services. The MSE Ingress is fully managed and O&M-free, supporting precise auto-scaling based on requests to accurately control the request concurrency of individual pods. This solution effectively meets traffic management requirements in scenarios where large numbers of cloud-native distributed applications are deployed.
Prerequisites
Knative has been deployed in your cluster. For more information, see Deploy Knative.
The MSE Ingress controller has been installed and authorized to access MSE. For more information, see Authorize the MSE Ingress controller to access MSE.
How it works
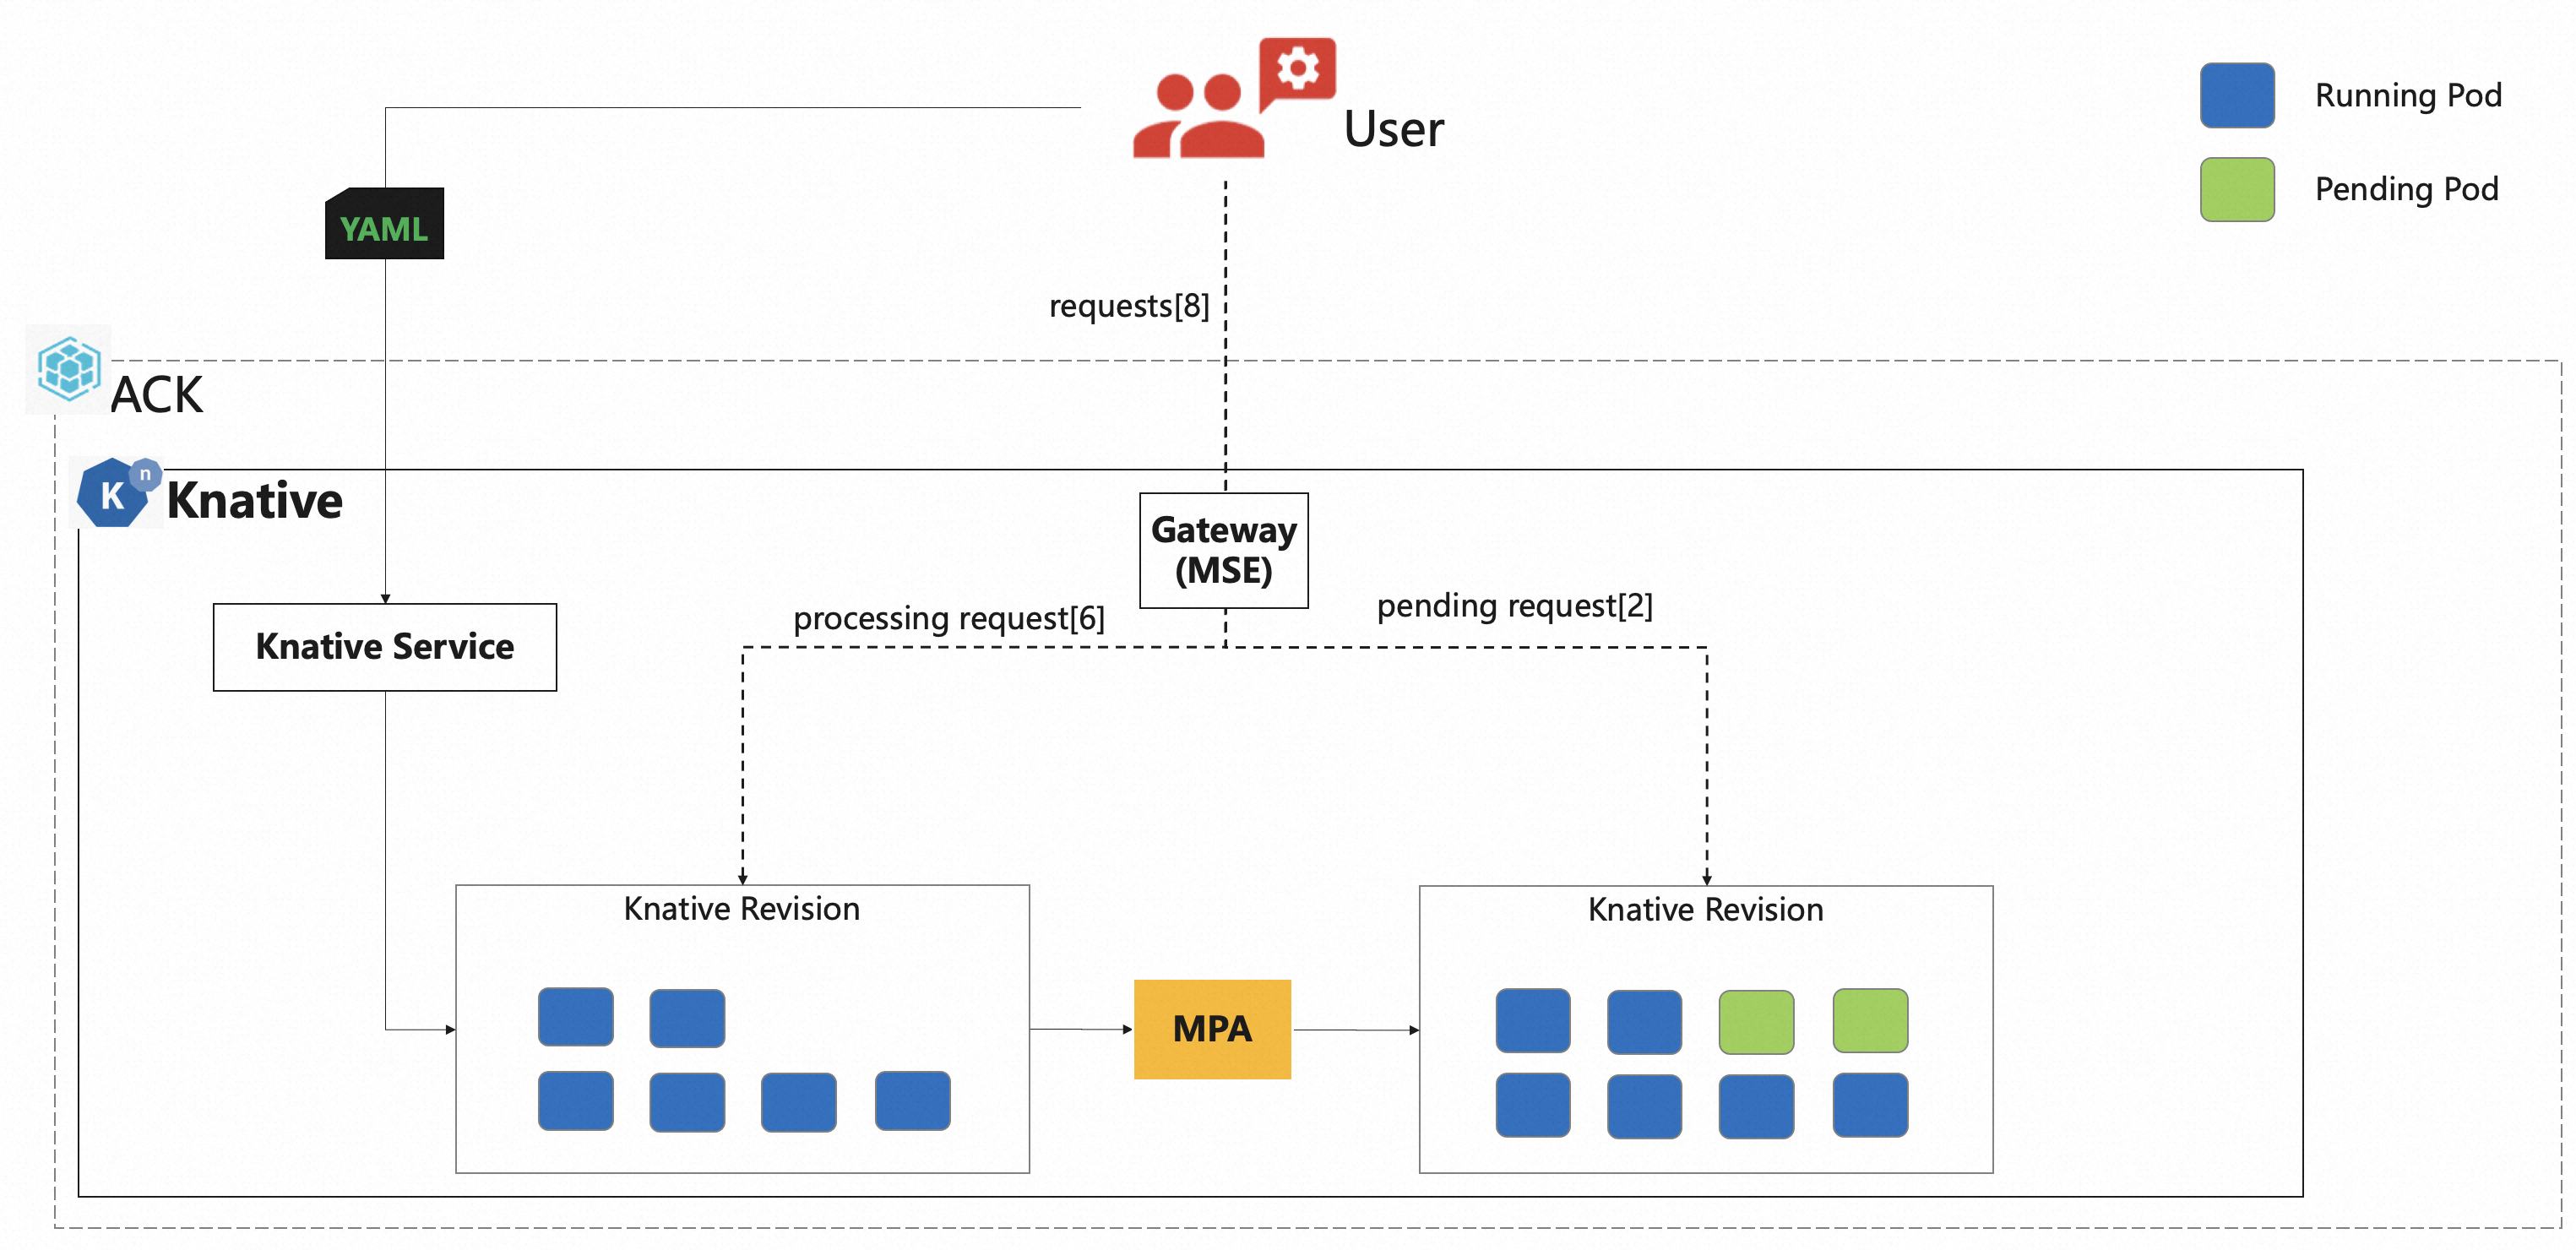
The throughput of an individual pod is limited. If multiple requests are routed to the same pod, the corresponding server may be overloaded. Therefore, you need to precisely control the number of concurrent requests processed by each pod. For example, in Artificial intelligence generated content (AIGC) scenarios, a single request may occupy large amounts of GPU resources. You need to strictly limit the number of concurrent requests processed by each pod. By working with the MSE Ingress, Knative can accurately scale out pods to meet traffic management requirements in scenarios where large numbers of cloud-native distributed applications are deployed.
In the following figure, the MultidimPodAutoscaler (MPA) obtains the total number of concurrent requests from the MSE Ingress, calculates the number of pods required for processing the requests, and then scales pods. This implements load-aware auto scaling. The MSE Ingress can accurately route requests to different services or versions based on routing rules and conditions.
Step 1: Deploy an MSE Ingress
Log on to the ACK console. In the left-side navigation pane, click Clusters.
On the Clusters page, find the cluster that you want to manage and click its name. In the left-side navigation pane, choose .
On the Components tab, click Deploy Knative, select MSE for the Gateway parameter, and finish the deployment as prompted.
Step 2: Use the MSE Ingress to access Services
Log on to the ACK console. In the left-side navigation pane, click Clusters.
On the Clusters page, find the cluster that you want to manage and click its name. In the left-side navigation pane, choose .
On the Services tab of the Knative page, set Namespace to default, click Create from Template, copy the following YAML content to the template editor, and then click Create.
The template creates a Service named
helloworld-go.ImportantReplace
{REGION-ID}with the region where your cluster resides so that the Knative Service can pull images as expected.apiVersion: serving.knative.dev/v1 kind: Service metadata: name: helloworld-go spec: template: metadata: annotations: autoscaling.knative.dev/class: mpa.autoscaling.knative.dev # Scale pods based on MSE metrics. Pods can be scaled to zero. autoscaling.knative.dev/max-scale: '20' # Set the maximum number of pods allowed to 20. spec: containerConcurrency: 5 # Set the maximum number of concurrent requests that each pod can process to 5. containers: - image: registry-vpc.{REGION-ID}.aliyuncs.com/knative-sample/helloworld-go:73fbdd56 # {REGION-ID} is the region where your cluster resides, such as cn-hangzhou. env: - name: TARGET value: "Knative"If the Status column of the Service displays Created, the Service is deployed.
On the Services page, record the domain name and gateway IP address of the
helloworld-goService in the Default Domain and Gateway columns, respectively.Run the following command to access the
helloworld-goService:curl -H "host: helloworld-go.default.example.com" http://8.141.XX.XX # Specify the actual gateway IP address and domain name that you obtained.Expected output:
Hello Knative!
Step 3: Perform auto scaling based on the number of concurrent requests
Install the load testing tool hey.
For more information about hey, see Hey.
Run the following command to perform a stress test on the Service:
# Send 100,000 requests, and set the concurrency to 50 and request timeout period to 180 seconds.
hey -n 100000 -c 50 -t 180 -host "helloworld-go.default.example.com" "http://8.141.XX.XX"
Expected output:
Summary:
  Total:        86.0126 secs
  Slowest:      0.1672 secs
  Fastest:      0.0276 secs
  Average:      0.0337 secs
  Requests/sec: 1162.6199

  Total data:   1500000 bytes
  Size/request: 15 bytes

Response time histogram:
  0.028 [1]     |
  0.042 [95291] |■■■■■■■■■■■■■■■■■■■■■■■■■■■■■■■■■■■■■■■■
  0.056 [4573]  |■■
  0.069 [64]    |
  0.083 [19]    |
  0.097 [2]     |
  0.111 [0]     |
  0.125 [0]     |
  0.139 [18]    |
  0.153 [23]    |
  0.167 [9]     |


Latency distribution:
  10% in 0.0294 secs
  25% in 0.0305 secs
  50% in 0.0327 secs
  75% in 0.0367 secs
  90% in 0.0386 secs
  95% in 0.0405 secs
  99% in 0.0433 secs

Details (average, fastest, slowest):
  DNS+dialup:   0.0000 secs, 0.0276 secs, 0.1672 secs
  DNS-lookup:   0.0000 secs, 0.0000 secs, 0.0000 secs
  req write:    0.0000 secs, 0.0000 secs, 0.0009 secs
  resp wait:    0.0336 secs, 0.0276 secs, 0.1671 secs
  resp read:    0.0000 secs, 0.0000 secs, 0.0009 secs

Status code distribution:
  [200] 100000 responses
The output indicates that 100,000 are sent. All requests are processed.
Run the following command to query the scaling of pods.
NoteThe command runs permanently until you manually terminate it. You can press
Ctrl + Cto terminate the command.kubectl get pods --watch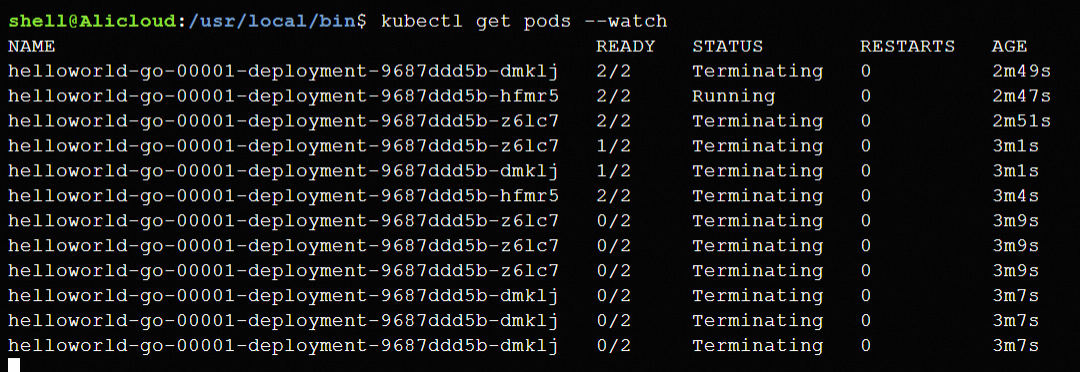
Step 4 (optional): View the monitoring data of the Service
Knative provides out-of-the-box monitoring features. On the Knative page, click the Monitoring Dashboards tab to view the monitoring data of the helloworld-go Service. For more information about how to enable the Knative dashboard, see View the Knative dashboard in Managed Service for Prometheus.