It is difficult to troubleshoot container service failures because the container engine layer is not transparent to users. To address this issue, Alibaba Cloud Container Service for Kubernetes (ACK) introduces SysOM. SysOM enhances the observability of container memory issues by providing container monitoring data at the operating system kernel layer. This allows you to view and diagnose issues at the container engine layer more transparently, and efficiently migrate containerized applications. This topic describes how to use SysOM to locate container memory issues.
Prerequisites
An ACK managed cluster is created or an ACK Serverless cluster is created after October 2021, and the Kubernetes version of the cluster is 1.18.8 or later. For more information about how to create a cluster, see Create an ACK managed cluster and Create an ACK Serverless cluster. For more information about how to update a cluster, see Manually upgrade ACK clusters.
Managed Service for Prometheus is enabled. For more information, see Enable Managed Service for Prometheus.
ack-sysom-monitor is enabled. For more information, see Enable ack-sysom-monitor.
Billing of ack-sysom-monitor
After the ack-sysom-monitor component is enabled, related components automatically send monitoring metrics to Managed Service for Prometheus. These metrics are considered as custom metrics. Fees are charged for custom metrics.
Before you enable this feature, we recommend that you read Billing overview to understand the billing rules of custom metrics. The fees may vary based on the cluster size and number of applications. You can follow the steps in View resource usage to monitor and manage resource usage.
Scenario
Containerization has become a best practice for enterprise IT architecture due to its advantages of low cost, high efficiency, flexibility, and scalability.
However, containerization compromises the transparency of the container engine layer, which can lead to excessive memory usage or even exceeding limits, triggering Out of Memory (OOM) issues.
The Alibaba Cloud Container Service for Kubernetes (ACK) team, in collaboration with the Alibaba Cloud GuestOS operating system team, has implemented precise memory management through container monitoring capabilities at the operating system kernel layer to prevent OOM issues.
Container memory
The memory of a container consists of application memory, kernel memory, and free memory.
Memory category | Memory subcategory | Description |
Application memory | Application memory consists of the following types:
| The memory occupied by a running application. |
Kernel memory | Kernel memory consists of the following types:
| Memory used by the OS kernel. |
Free memory | None. | Memory that is not used. |
How it works
Kubernetes uses memory working sets to monitor and manage container memory usage. When the memory occupied by containers exceeds the specified memory upper limit or a node faces memory pressure, Kubernetes determines whether to evict or terminate the container based on the working set. By monitoring the working set of a pod through SysOM, you can obtain more comprehensive and accurate memory monitoring and analysis capabilities. This helps O&M personnel and developers quickly locate and resolve issues with large working sets and improves container performance and stability.
Memory working sets refer to the actual memory used by a container within a certain time range, which is the memory required for the current operation of the container. The specific calculation formula is Working set = InactiveAnon + ActiveAnon + ActiveFile. InactiveAnon and ActiveAnon represent the total amount of anonymous memory for an application, and ActiveFile represents the size of the active file cache of the application. By monitoring and analyzing, O&M personnel can more effectively manage resources to ensure the continuous and stable operation of applications.
Use the SysOM feature
The OS kernel-level dashboards of SysOM allow you to view the system metrics, such as memory, network, and storage metrics, of pods and nodes in real time. For more information about SysOM metrics, see Kernel-level container monitoring based on SysOM.
Log on to the ACK console. In the left-side navigation pane, click Clusters.
On the Clusters page, find the cluster that you want to manage and click its name. In the left-side pane, choose .
On the Prometheus Monitoring page, choose SysOM > SysOM - Pods to view the pod memory data on the dashboard.
Analyze how to locate missing memory issues based on the calculation formula.
Pod total memory = RSS resident memory + Cache ≈ inactive_anon + active_anon + inactive_file + active_file
Working set = inactive_anon + active_anon + active_file
In the Pod Memory Monitor section, according to the pod total memory formula, you can first divide the pod memory into cache and RSS memory. Then, divide the cache into three types: active_file, inactive_file, and shmem (shared memory), and divide the RSS memory into two types: active_anon and inactive_anon.
As shown in the following figure, inactive_anon accounts for the largest proportion.

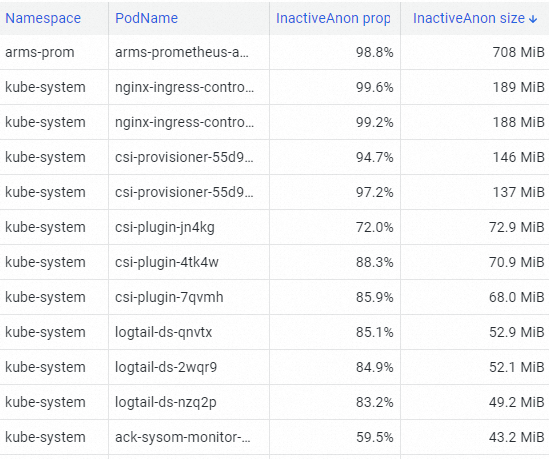
In the Pod Resource Analysis section, use the top command to find the pod that occupies the most InactiveAnon memory in the cluster.
The arms-prom pod occupies the most InactiveAnon memory, as shown in the following figure.

In the Pod Memory Details section, you can view the memory usage details of pods. Based on the pod memory metrics displayed on the dashboard, such as pod cache, InactiveFile, InactiveAnon, and Dirty Memory, you can identify common missing memory issues in pods.

In the Pod File Cache section, locate the cause of large cache memory.
When a pod occupies large amounts of memory, the memory working set of the pod may exceed the actual in-use memory size. The missing memory issue adversely affects the performance of the application to which the pod belongs.

Fix the missing memory issue.
You can use the fine-grained scheduling feature provided by ACK to fix the missing memory issue. For more information, see Enable memory QoS.
References
For more information about SysOM metrics, see Kernel-level container monitoring based on SysOM.
For more information about the memory quality of service (QoS) feature of containers, see Overview of kernel features and interfaces.