When you deploy a Stable Diffusion Service based on Knative in a Container Service for Kubernetes (ACK) cluster, the Knative solution allows you to accurately control the maximum number of concurrent requests that a pod can process based on its throughput. This ensures the stability of the Service. Knative can also automatically scale in pods to zero when no traffic is expected. This reduces the expenses on GPU resources.
Prerequisites
An ACK cluster that runs Kubernetes 1.24 or later is created, and the cluster contains GPU-accelerated nodes. For more information, see Create an ACK managed cluster.
We recommend that you select
ecs.gn5-c4g1.xlarge,ecs.gn5i-c8g1.2xlarge, orecs.gn5-c8g1.2xlarge.Knative is deployed in the cluster. For more information, see Deploy and manage Knative.
Procedure
You must abide by the user agreements, usage specifications, and relevant laws and regulations of the third-party model Stable Diffusion. Alibaba Cloud does not guarantee the legitimacy, security, or accuracy of Stable Diffusion. Alibaba Cloud shall not be held liable for any damages caused by the use of Stable Diffusion.
Stable Diffusion can generate target scenes and images quickly and accurately. However, deploying Stable Diffusion in a production environment presents several challenges:
Limited throughput: A single pod can only handle a limited number of requests. Forwarding too many concurrent requests to one pod can overload the server.
Cost management: GPU resources are expensive. To manage costs effectively, they must be provisioned on-demand and released promptly during periods of low traffic.
ACK Knative addresses these challenges by providing concurrency-based autoscaling. By precisely managing the number of concurrent requests sent to each pod, it can automatically scale the number of replicas up or down, enabling you to build a production-grade, cost-effective Stable Diffusion Service.

Step 1: Deploy a Stable Diffusion Service
You must ensure that the Stable Diffusion Service is correctly deployed on the GPU-accelerated node. Otherwise, the Stable Diffusion Service cannot be used.
Log on to the ACK console. In the left navigation pane, click Clusters.
On the Clusters page, find the cluster you want and click its name. In the left navigation pane, choose .
Deploy a Stable Diffusion Service.
ACK Knative provides commonly used application templates. You can quickly deploy the Stable Diffusion Service by using an application template or a YAML file.
Application template
Click the Popular Apps tab and click Quick Deployment on the stable-diffusion card.

After the deployment, click Services to view the deployment status in the Service list. If the Status is Created, the Service is deployed.
YAML
On the Services tab, select default from the Namespace drop-down list and click Create from Template. Copy the following YAML template to the code editor and click Create to create a Service named
stable-diffusion.apiVersion: serving.knative.dev/v1 kind: Service metadata: name: stable-diffusion annotations: serving.knative.dev.alibabacloud/affinity: "cookie" serving.knative.dev.alibabacloud/cookie-name: "sd" serving.knative.dev.alibabacloud/cookie-timeout: "1800" spec: template: metadata: annotations: autoscaling.knative.dev/class: kpa.autoscaling.knative.dev autoscaling.knative.dev/maxScale: '10' autoscaling.knative.dev/targetUtilizationPercentage: "100" k8s.aliyun.com/eci-use-specs: ecs.gn5-c4g1.xlarge,ecs.gn5i-c8g1.2xlarge,ecs.gn5-c8g1.2xlarge spec: containerConcurrency: 1 containers: - args: - --listen - --skip-torch-cuda-test - --api command: - python3 - launch.py image: yunqi-registry.cn-shanghai.cr.aliyuncs.com/lab/stable-diffusion@sha256:62b3228f4b02d9e89e221abe6f1731498a894b042925ab8d4326a571b3e992bc imagePullPolicy: IfNotPresent ports: - containerPort: 7860 name: http1 protocol: TCP name: stable-diffusion readinessProbe: tcpSocket: port: 7860 initialDelaySeconds: 5 periodSeconds: 1 failureThreshold: 3The Service is deployed if it has the following status.

Step 2: Access the Stable Diffusion Service
On the Services tab, record the gateway IP address and default domain name of the Service.
NoteIf you use the ALB Ingress, you can access the Service using the following
curlcommand format:curl -H "Host: stable-diffusion.default.example.com" http:alb-XXX.cn-hangzhou.alb.aliyuncsslb.com # Replace with the actual address of your ALB Ingress.For direct access, configure a CNAME record for an ALB instance.
Map the Service's gateway address to the domain you wish to access by adding an entry to your local
hostsfile. The following sample code is an example:47.xx.xxx.xx stable-diffusion.default.example.com # Replace with your actual gateway IP address.After modifying the
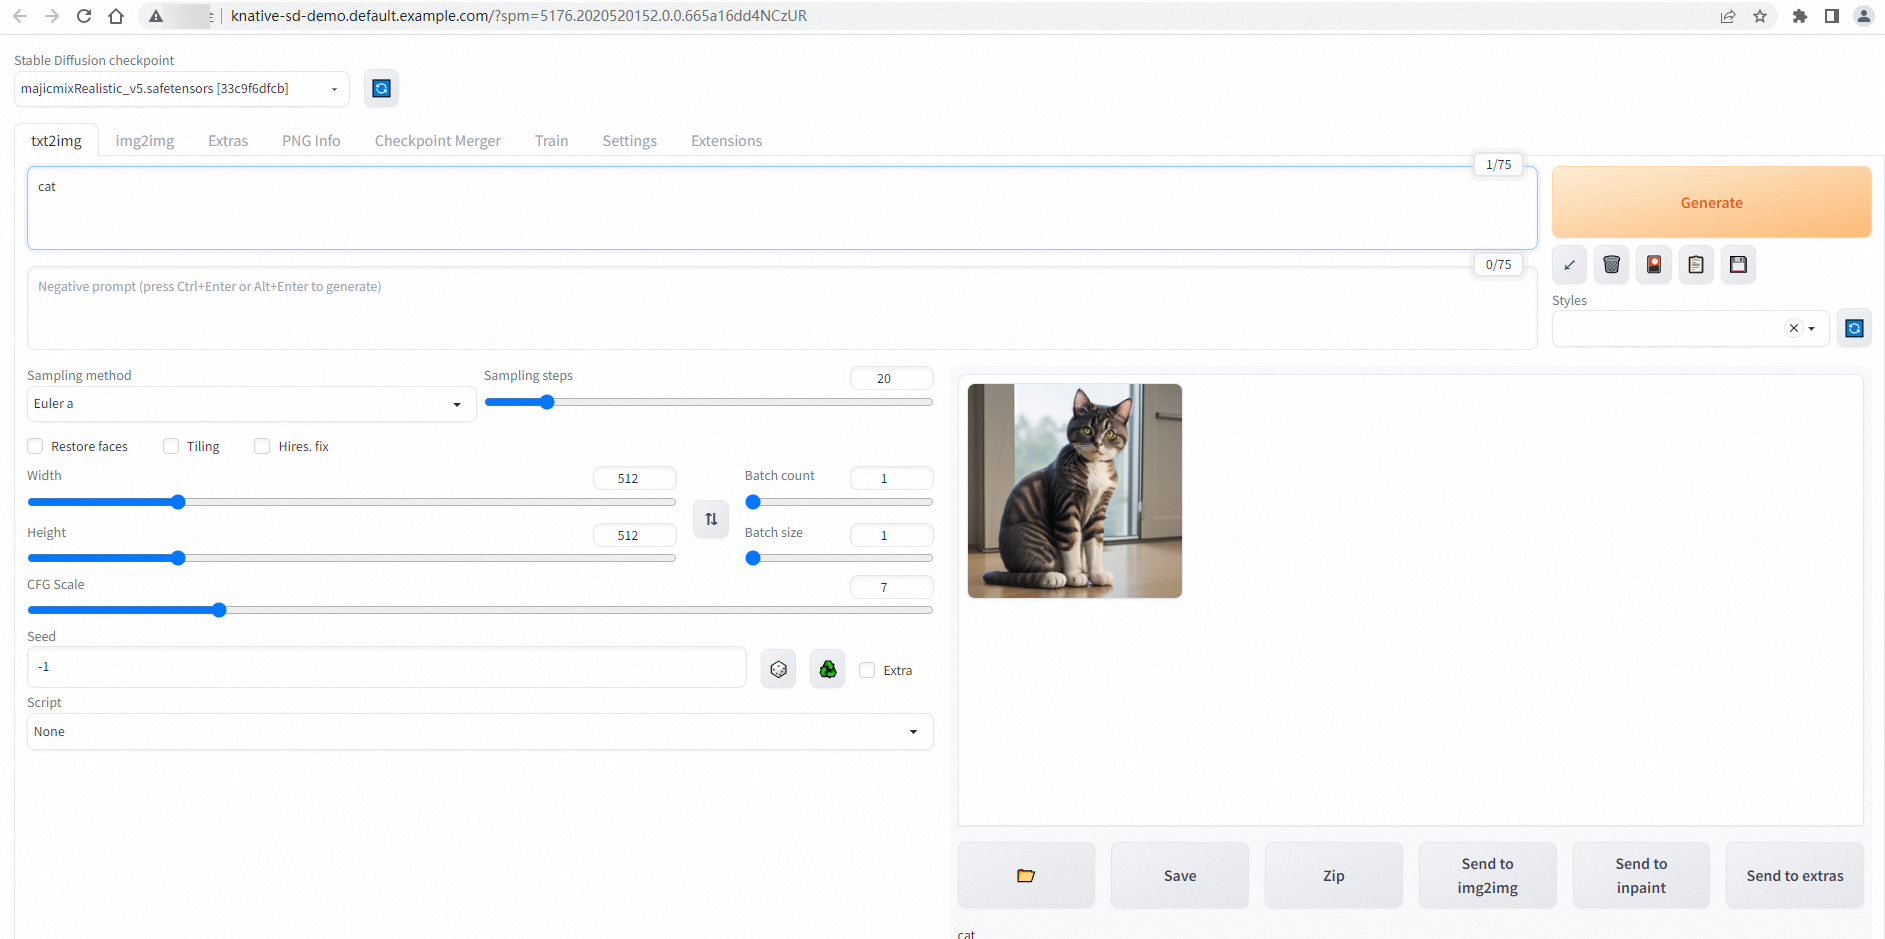
hostsfile, go to the Services tab, and click the default domain name of thestable-diffusionService to access the Service.If the following page appears, the configuration is successful.

Step 3: Enable auto scaling based on requests
Use the load testing tool
heyto perform stress tests.NoteFor more information about the hey tool that is used for stress testing, see hey.
hey -n 50 -c 5 -t 180 -m POST -H "Content-Type: application/json" -d '{"prompt": "pretty dog"}' http://stable-diffusion.default.example.com/sdapi/v1/txt2imgSend 50 requests with 5 concurrent requests in each batch and set the timeout period to 180 seconds.
Expected output:
Summary:
  Total:	252.1749 secs
  Slowest:	62.4155 secs
  Fastest:	9.9399 secs
  Average:	23.9748 secs
  Requests/sec:	0.1983


Response time histogram:
  9.940 [1]	|■■
  15.187 [17]	|■■■■■■■■■■■■■■■■■■■■■■■■■■■■■■■■■■■■■■■■
  20.435 [9]	|■■■■■■■■■■■■■■■■■■■■■
  25.683 [11]	|■■■■■■■■■■■■■■■■■■■■■■■■■■
  30.930 [1]	|■■
  36.178 [1]	|■■
  41.425 [3]	|■■■■■■■
  46.673 [1]	|■■
  51.920 [2]	|■■■■■
  57.168 [1]	|■■
  62.415 [3]	|■■■■■■■


Latency distribution:
  10% in 10.4695 secs
  25% in 14.8245 secs
  50% in 20.0772 secs
  75% in 30.5207 secs
  90% in 50.7006 secs
  95% in 61.5010 secs
  0% in 0.0000 secs

Details (average, fastest, slowest):
  DNS+dialup:	0.0424 secs, 9.9399 secs, 62.4155 secs
  DNS-lookup:	0.0385 secs, 0.0000 secs, 0.3855 secs
  req write:	0.0000 secs, 0.0000 secs, 0.0004 secs
  resp wait:	23.8850 secs, 9.9089 secs, 62.3562 secs
  resp read:	0.0471 secs, 0.0166 secs, 0.1834 secs

Status code distribution:
  [200]	50 responses
The output shows that all 50 requests are successfully processed.
Run the following command to query the pods:
watch -n 1 'kubectl get po'
The output shows that 5 pods are created for the Stable Diffusion Service. This is because
containerConcurrency: 1is configured for the Service, which indicates that a pod can concurrently process at most 1 request.
Step 4: View the monitoring data of the Stable Diffusion Service
Knative provides out-of-the-box observability features. You can view the monitoring data of the Stable Diffusion Service on the Monitoring Dashboards of the Knative page. To enable and use Knative dashboards, see View the Knative monitoring dashboard.
References
To deploy AI inference services in Knative, see Best practices for deploying AI inference services in Knative.