Kubernetes provides a Custom Metrics mechanism that integrates with Managed Service for Prometheus to collect GPU metrics. This topic describes how to deploy Managed Service for Prometheus and provides an example of how to use Managed Service for Prometheus to monitor GPU metrics and implement auto scaling for containers.
Prerequisites
You have added a GPU node to your cluster or created a dedicated GPU cluster.
Overview
In high-performance computing (HPC) scenarios, such as deep learning model training and inference, GPUs are often used to accelerate computation. To save costs, use auto scaling based on GPU metrics, such as GPU utilization and GPU memory.
By default, Kubernetes uses CPU and memory as metrics for Horizontal Pod Autoscaler (HPA) auto scaling. For more complex scenarios, such as auto scaling based on GPU metrics, use Prometheus Adapter to adapt the GPU metrics collected by Prometheus. Then, use the Custom Metrics API to extend the HPA metrics. This workflow lets you implement auto scaling based on metrics such as GPU utilization and GPU memory. The following figure shows how GPU auto scaling works.

Step 1: Deploy Managed Service for Prometheus and Metrics Adapter
- Note
If you selected to install Prometheus when you created the cluster, you do not need to install it again.
Install and configure ack-alibaba-cloud-metrics-adapter.
1. Obtain the HTTP API address
Log on to the ARMS console.
-
In the left navigation pane, choose .
At the top of the page, select the region where your Container Service for Kubernetes (ACK) cluster is located. Then, click the name of the target instance.
On the Settings page, click the Settings tab. In the HTTP API URL (Grafana Read Address) section, copy the internal network address.
2. Configure the Prometheus URL
Log on to the ACK console. In the left-side navigation pane, choose .
On the App Marketplace page, click the App Catalog tab. Search for and click ack-alibaba-cloud-metrics-adapter.
On the ack-alibaba-cloud-metrics-adapter page, click Deploy.
In the Basic Information wizard, select a cluster and namespace, and then click Next.
In the Parameters wizard, select a Chart Version. In the Parameters section, set the value of the Prometheus
urlparameter to the HTTP API address that you obtained. Then, click OK.
Step 2: Configure Adapter Rules for GPU metrics
1. Query GPU metrics
You can query GPU metrics. For more information, see Monitoring metric descriptions.
2. Configure Adapter Rules
Log on to the ACK console. In the left navigation pane, click Clusters.
On the Clusters page, find the cluster you want and click its name. In the left-side navigation pane, choose .
In the Actions column of the Helm release, click Update for ack-alibaba-cloud-metrics-adapter. Add the following
rulesto thecustomfield.After you add the rules, the configuration is displayed as shown in the following figure.
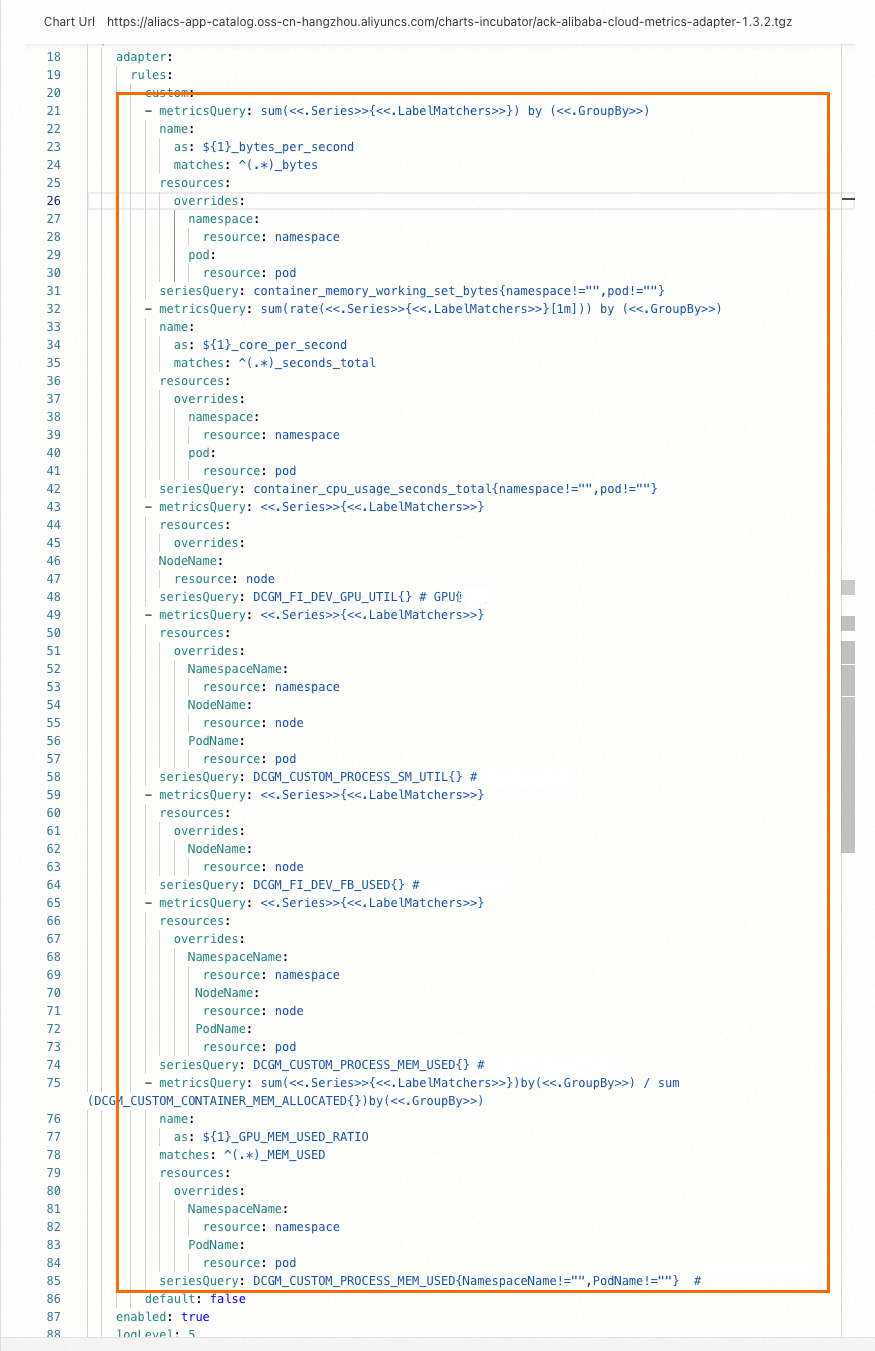
Run the following command. If the output contains metrics that HPA can recognize, such as
DCGM_FI_DEV_GPU_UTIL,DCGM_CUSTOM_PROCESS_SM_UTIL,DCGM_FI_DEV_FB_USED, andDCGM_CUSTOM_PROCESS_MEM_USED, the configuration is complete. This example usesDCGM_CUSTOM_PROCESS_SM_UTIL. The actual output may vary.
Step 3: Implement auto scaling based on GPU metrics
This example deploys a model inference service on a GPU. Then, it runs a stress test on the service to test auto scaling based on GPU utilization.
1. Deploy the inference service
Run the following command to deploy the inference service.
Check the status of the pod and service.
Run the following command to check the pod status.
kubectl get pods -o wideExpected output:
NAME                                    READY   STATUS    RESTARTS   AGE     IP           NODE                        NOMINATED NODE   READINESS GATES
bert-intent-detection-7b486f6bf-f****   1/1     Running   0          3m24s   10.15.1.17   cn-beijing.192.168.94.107   <none>           <none>
The expected output shows that only one pod is deployed on the GPU node 192.168.94.107.
Run the following command to check the service status.
kubectl get svc bert-intent-detection-svcExpected output:
NAME                        TYPE           CLUSTER-IP       EXTERNAL-IP   PORT(S)        AGE
bert-intent-detection-svc   LoadBalancer   172.16.186.159   47.95.XX.XX   80:30118/TCP   5m1s
The service name in the expected output indicates that the service is deployed.
Log on to the GPU node 192.168.94.107 using Secure Shell (SSH). Then, run the following command to check the GPU usage.
nvidia-smiExpected output:
Wed Feb 16 11:48:07 2022
+-----------------------------------------------------------------------------+
| NVIDIA-SMI 450.102.04   Driver Version: 450.102.04   CUDA Version: 11.0     |
|-------------------------------+----------------------+----------------------+
| GPU  Name        Persistence-M| Bus-Id        Disp.A | Volatile Uncorr. ECC |
| Fan  Temp  Perf  Pwr:Usage/Cap|         Memory-Usage | GPU-Util  Compute M. |
|                               |                      |               MIG M. |
|===============================+======================+======================|
|   0  Tesla V100-SXM2...  On   | 00000000:00:07.0 Off |                    0 |
| N/A   32C    P0    55W / 300W |  15345MiB / 16160MiB |      0%      Default |
|                               |                      |                  N/A |
+-------------------------------+----------------------+----------------------+

+-----------------------------------------------------------------------------+
| Processes:                                                                  |
|  GPU   GI   CI        PID   Type   Process name                  GPU Memory |
|        ID   ID                                                   Usage      |
|=============================================================================|
|    0   N/A  N/A   2305118      C   python                          15343MiB |
+-----------------------------------------------------------------------------+
The expected output shows that the inference service process is running on the GPU. Because no requests have been sent, the current GPU utilization is 0.
Run the following command to call the inference service and verify the deployment.
curl -v "http://47.95.XX.XX/predict?query=Music"Expected output:
*   Trying 47.95.XX.XX...
* TCP_NODELAY set
* Connected to 47.95.XX.XX (47.95.XX.XX) port 80 (#0)
> GET /predict?query=Music HTTP/1.1
> Host: 47.95.XX.XX
> User-Agent: curl/7.64.1
> Accept: */*
>
* HTTP 1.0, assume close after body
< HTTP/1.0 200 OK
< Content-Type: text/html; charset=utf-8
< Content-Length: 9
< Server: Werkzeug/1.0.1 Python/3.6.9
< Date: Wed, 16 Feb 2022 03:52:11 GMT
<
* Closing connection 0
PlayMusic # Intent recognition result.
The HTTP request returns a status code of 200 and the intent recognition result. This indicates that the inference service is deployed.
2. Configure the HPA
This example uses GPU utilization. When the GPU utilization of a pod exceeds 20%, a scale-out is triggered. The HPA supports the following metrics.
Metric | Description | Unit |
DCGM_FI_DEV_GPU_UTIL |
| % |
DCGM_FI_DEV_FB_USED |
| MiB |
DCGM_CUSTOM_PROCESS_SM_UTIL | GPU utilization of the container. | % |
DCGM_CUSTOM_PROCESS_MEM_USED | GPU memory usage of the container. | MiB |
DCGM_CUSTOM_PROCESS_GPU_MEM_USED_RATIO | GPU memory utilization of the container.
| % |
Run the following command to deploy the HPA.
v1.23 or later
cat <<EOF | kubectl create -f -
apiVersion: autoscaling/v2  # Use the autoscaling/v2 version for HPA configuration.
kind: HorizontalPodAutoscaler
metadata:
  name: gpu-hpa
spec:
  scaleTargetRef:
    apiVersion: apps/v1
    kind: Deployment
    name: bert-intent-detection
  minReplicas: 1
  maxReplicas: 10
  metrics:
  - type: Pods
    pods:
      metric:
        name: DCGM_CUSTOM_PROCESS_SM_UTIL
      target:
        type: Utilization
        averageValue: 20 # A scale-out is triggered when the container's GPU utilization exceeds 20%.
EOF
Earlier than v1.23
cat <<EOF | kubectl create -f -
apiVersion: autoscaling/v2beta1  # Use the autoscaling/v2beta1 version for HPA configuration.
kind: HorizontalPodAutoscaler
metadata:
  name: gpu-hpa
spec:
  scaleTargetRef:
    apiVersion: apps/v1
    kind: Deployment
    name: bert-intent-detection
  minReplicas: 1
  maxReplicas: 10
  metrics:
  - type: Pods
    pods:
      metricName: DCGM_CUSTOM_PROCESS_SM_UTIL # GPU utilization of the pod.
      targetAverageValue: 20 # A scale-out is triggered when the container's GPU utilization exceeds 20%.
EOF
Run the following command to check the HPA status.
kubectl get hpaExpected output:
NAME      REFERENCE                          TARGETS   MINPODS   MAXPODS   REPLICAS   AGE
gpu-hpa   Deployment/bert-intent-detection   0/20      1         10        1          74s
The expected output shows that
TARGETSis0/20. This indicates that the current GPU utilization is 0. A scale-out is triggered when the GPU utilization exceeds 20%.
3. Test auto scaling for the inference service
Scale-out
Run the following command to perform a stress test.
hey -n 10000 -c 200 "http://47.95.XX.XX/predict?query=music"NoteThe formula to calculate the desired number of replicas for an HPA scale-out is:
Desired Replicas = ceil[Current Replicas × (Current Metric / Desired Metric)]. For example, the current number of replicas is 1, the current metric is 23, and the desired metric is 20; the formula calculates the desired number of replicas as 2.During the stress test, monitor the status of the HPA and the pods.
Run the following command to check the HPA status.
kubectl get hpaExpected output:
NAME      REFERENCE                          TARGETS   MINPODS   MAXPODS   REPLICAS   AGE
gpu-hpa   Deployment/bert-intent-detection   23/20     1         10        2          7m56s
The output shows that the
TARGETSvalue is23/20. This value indicates that the current GPU utilization exceeds 20%, which triggers auto scaling and causes the cluster to scale out.Run the following command to check the pod status.
kubectl get podsExpected output:
NAME                                    READY   STATUS    RESTARTS   AGE
bert-intent-detection-7b486f6bf-f****   1/1     Running   0          44m
bert-intent-detection-7b486f6bf-m****   1/1     Running   0          14s
The expected output shows that there are two pods. The formula calculates that the total number of pods should be 2. This matches the actual output.
The expected outputs for the HPA and pods indicate that the pods were successfully scaled out.
Scale-in
When the stress test stops, the GPU utilization drops below 20%. The system then starts to scale in.
Run the following command to check the HPA status.
kubectl get hpaExpected output:
NAME      REFERENCE                          TARGETS   MINPODS   MAXPODS   REPLICAS   AGE
gpu-hpa   Deployment/bert-intent-detection   0/20      1         10        1          15m
The expected output shows that
TARGETSis0/20. This indicates that the current GPU utilization is 0. After about five minutes, the system starts to scale in.Run the following command to check the pod status.
kubectl get podsExpected output:
NAME                                    READY   STATUS    RESTARTS   AGE
bert-intent-detection-7b486f6bf-f****   1/1     Running   0          52m
The expected output shows that the number of pods is 1. This indicates that the scale-in was successful.
FAQ
How can I determine if a GPU card is being used?
You can check the GPU Monitoring tab to observe fluctuations in GPU card utilization to determine whether a GPU card is in use. If the utilization increases, the GPU card is being used. If the utilization does not change, the card is not being used. To do this, perform the following steps:
Log on to the ACK console. In the left navigation pane, click Clusters.
On the Clusters page, find the cluster you want and click its name. In the left navigation pane, choose .
On the Prometheus Monitoring page, click the GPU Monitoring tab. Observe the fluctuations in GPU card utilization.